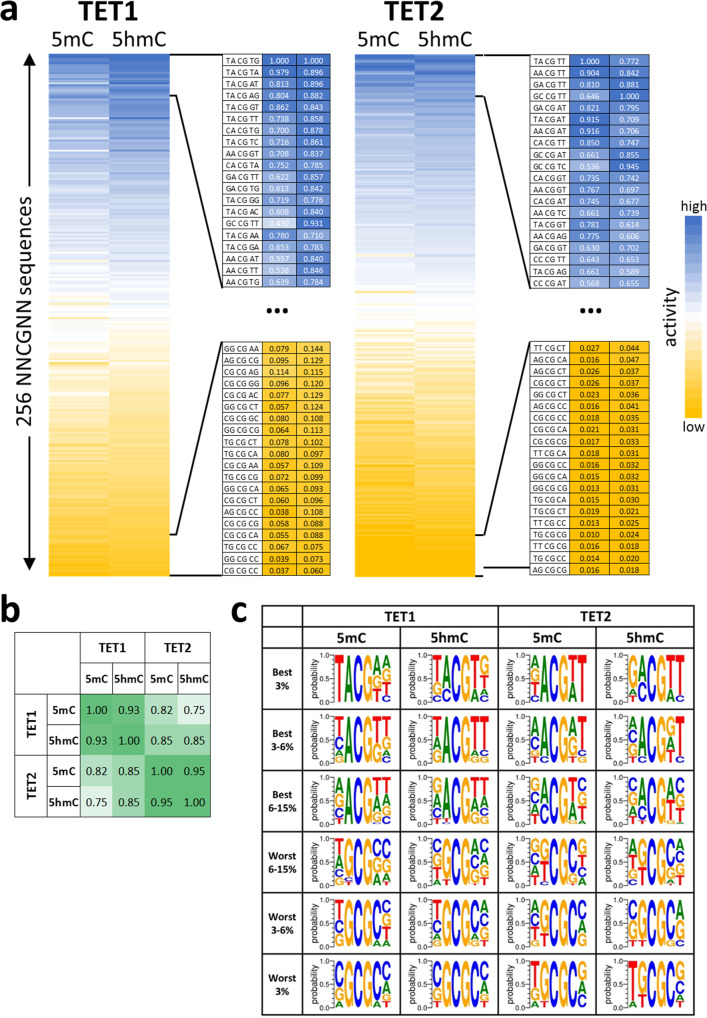
Fig. 2. Flanking sequence effects on the oxidation of mCpG and hmCpG substrates by TET1 and TET2.
a Heatmap of the average activities of TET1 and TET2 at NNmCpGNN and NNhmCpGNN sites sorted by the average activity. The enlargements show the activity and sequence of the most preferred and disfavored flanking sequences. b Pairwise Pearson correlation factors of the flank profiles shown in panel a. All data were compiled in Supplementary Data 1. c Weblogos of the enrichment of bases at the different flank positions in subsets of the most preferred and disfavored NNCGNN flanking sequences. Weblogos were prepared using WebLogo 3 (http://weblogo.threeplusone.com/).

