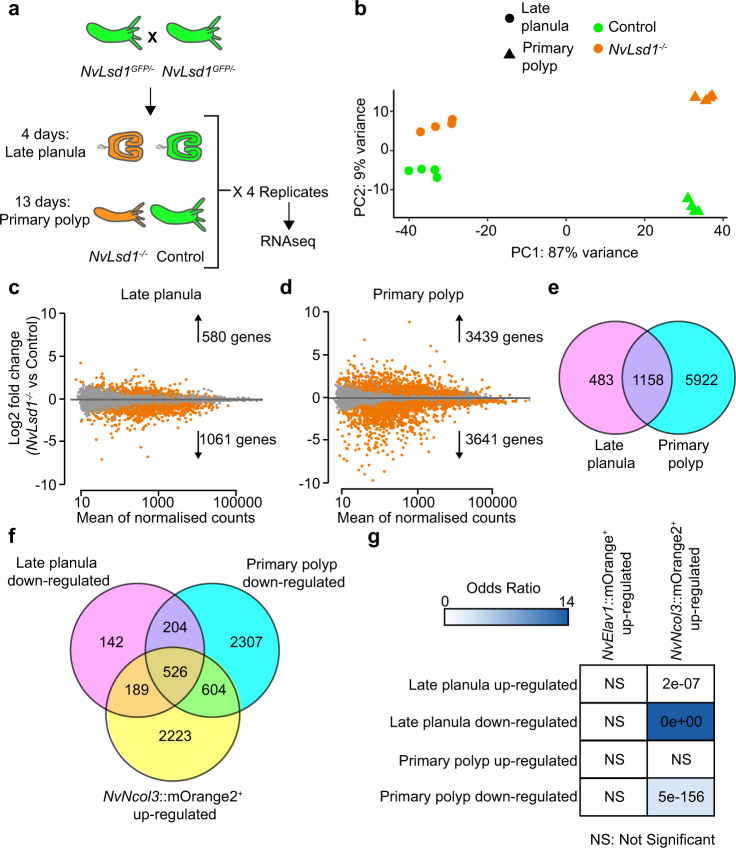
Fig. 4. Transcriptomic analysis of NvLsd1 mutants.
a Cartoon depicting the experimental design for the transcriptome analysis of NvLsd1 mutants. Controls are shown in green, and mutants are shown in orange. b PCA plot using the gene counts after variance stabilizing transformation (VST). Late planula samples are shown as circles and primary polyp as triangles. Experimental conditions are encoded with color: green for controls and orange for mutants. c, d MA-plots of up- and down- regulated genes between NvLsd1−/− and control in late planula (c) and primary polyps (d). Differentially expressed genes are shown in orange at significance level of 0.05. e Venn diagram comparing all differentially expressed genes at late planula and primary polyp stages. f Venn diagram comparing genes downregulated in NvLsd1−/− late planula and primary polyp with genes upregulated in NvNcol3::mOrange2+ cells. g Comparison of the overlap between up- and downregulated genes in NvLsd1−/− late planula and primary polyps with those upregulated in NvNcol3::mOrange2+ and NvElav1::mOrange+ cells using the GeneOverlap R package. The strength of the blue color indicates the odds ratio and numbers indicate the p-value, calculated using one-sided Fisher’s exact test.

