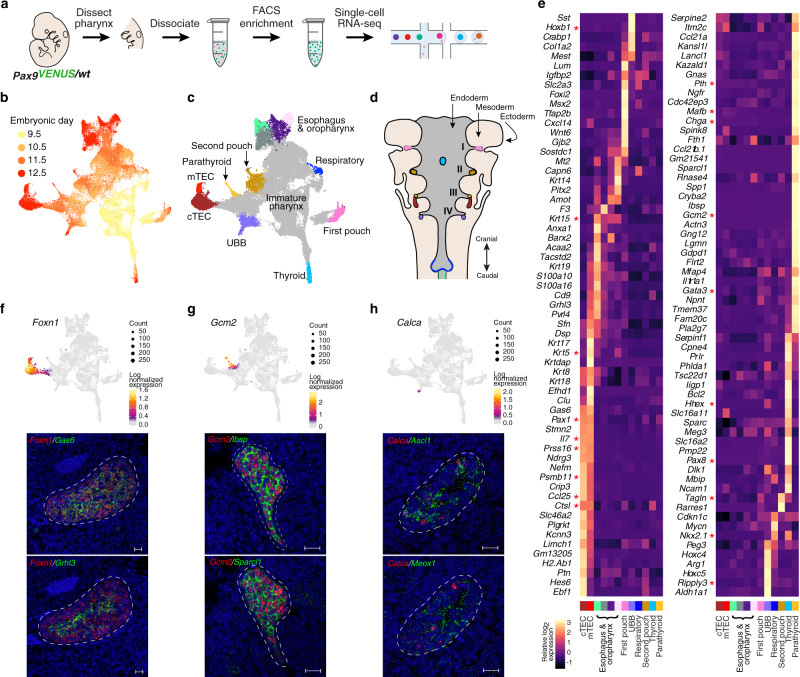
Fig. 1. Single-cell transcriptomic map of developing mouse pharyngeal endoderm from pouch formation to early organogenesis.
a Experimental workflow schematic. Pax9VENUS embryos were harvested at E9.5 (n = 2), E10.5 (n = 3), E11.5 (n = 3), and E12.5 (n = 2), and the pharyngeal region was dissected. Tissue samples were dissociated into a single-cell solution and then pharyngeal endoderm cells were FACS purified based on co-expression of VENUS and Epcam. Single-cell transcriptomes were captured and barcoded using Chromium Single-cell 3′ Reagents. b, c UMAP visualization of pharyngeal endoderm transcriptomic time-course dataset (n = 54,044 cells) colored by embryonic day (b) and terminal Louvain clusters corresponding to anatomical structures (c). Each dot represents a single-cell in the global transcriptomic space. mTEC medullary thymic epithelial cells, cTEC cortical thymic epithelial cells, UBB ultimobranchial body. d Diagram of pharyngeal endoderm with pharyngeal pouches I–IV indicated. Organ colors correspond to cluster colors in (c). e Heatmap displaying differentially expressed marker genes by terminal clusters. Row-standardized heatmap of data-driven terminal cluster marker genes. Genes displayed represent a log2-fold-change cutoff of >1.5 and a p-value of <0.01. f–h UMAP visualization of expression of select tissue-specific marker genes with corresponding RNAscope data. Cells are binned by UMAP coordinate with size proportional to the number of cells and color signifying average log2-normalized expression. Data-driven and known transcripts of the thymus (data-driven: Grhl3, Gas6; known: Foxn1; n = 3) (f), parathyroid (data-driven: Ibsp, Sparcl1; known: Gcm2; n = 3) (g), and ultimobranchial body (data-driven: Ascl1, Meox1; known: Calca; n = 2) (h) lineages were visualized using RNAscope in situ hybridization. Scale bars represent 20 µm.

