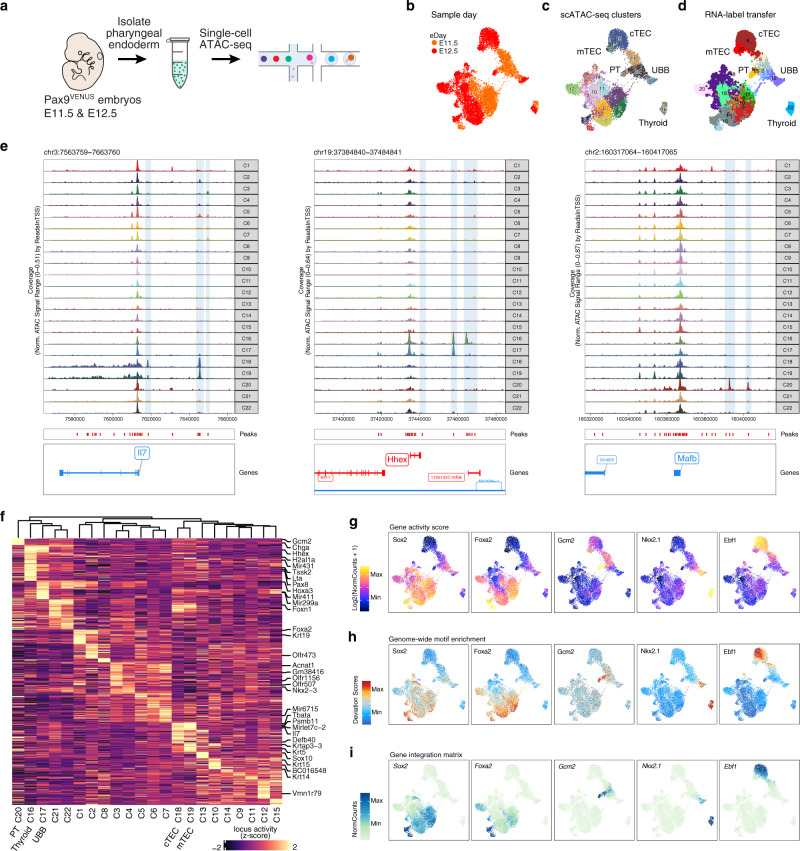
Fig. 2. Single-cell chromatin map of developing mouse pharyngeal endoderm during early organogenesis.
a Experimental workflow schematic. Single cells were prepared as described in Fig. 1a from E11.5 (n = 2) and E12.5 (n = 2) Pax9VENUS embryos. Single-cell chromatin landscapes were captured and barcoded using Chromium Single-cell ATAC Reagents. b–d UMAP visualization of pharyngeal endoderm early organogenesis chromatin accessibility dataset (n = 10,890 cells) colored by embryonic day (b), Louvain clusters (c), and scRNA label transfer (see Supplementary Fig. 3 for cluster color labels) (d). Each dot represents one cell in the global chromatin accessibility space. cTEC, cortical thymic epithelial cells; mTEC, medullary thymic epithelial cells; PT, parathyroid; UBB, ultimobranchial body. e Normalized genome browser tracks of three tissue-specific loci (Il7, Hhex, and Mafb) highlighting annotated peaks. Each track displays pseudobulk ATAC data aggregated and colored by Louvain cluster from (c). f Heatmap of differential (p-value ≤ 0.1, log2-fold change ≥ 0.5) cluster-specific predicted gene expression (ArchR gene score) of the top 50 genes per cluster, row z-scored with clusters ordered by unsupervised hierarchical clustering. g–i Tissue-specific TF activity through gene activity score (g), genome-wide motif enrichment (h) and, inferred RNA expression based on the gene integration matrix (i).

