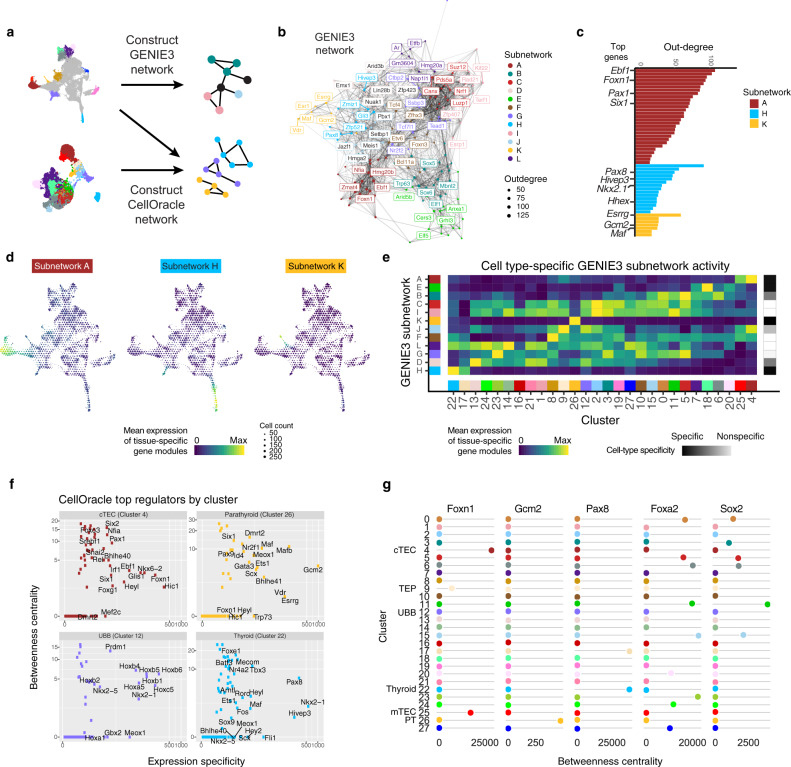
Fig. 4. Gene regulatory networks reveal cell-type-specific regulatory interactions.
a Gene regulatory network (GRN) schematic for our two complementary approaches, GENIE3 and CellOracle. b GENIE3 GRN showing the top 200 regulators clustered into subnetworks. Regulators were filtered according to predicted regulation of the top differentially expressed genes across the entire dataset. The top 5 regulators of each subnetwork are labeled. c Regulators ranked by outdegree for three GENIE3 subnetworks: A, H, and K. d UMAP embeddings of the mean scRNA expression of subnetwork specific genes showing three highly cell-type-specific subnetworks. Subnetworks A, H, and K correspond to the thymus, thyroid, and parathyroid, respectively. Cells are binned by UMAP coordinate with size proportional to the number of cells and color signifying average log2-normalized expression. e Heatmap showing the cell-type specificity of GENIE3 subnetworks using the mean subnetwork activity on the scRNA atlas clusters. f Bivariate plot of average betweenness centrality from the cluster-specific CellOracle network and normalized expression specificity (average cluster-specific expression/median average cluster-specific expression) showing the top regulators per cluster. g Betweenness centrality network score dynamics as estimated by CellOracle across clusters for selected regulators of thymus (Foxn1), parathyroid (Gcm2), thyroid (Pax8), anterior foregut (Foxa2 and Sox2) development. cTEC cortical thymic epithelial cell, TEP thymic epithelial progenitor, UBB ultimobranchial body, mTEC medullary thymic epithelial cell, PT parathyroid.

