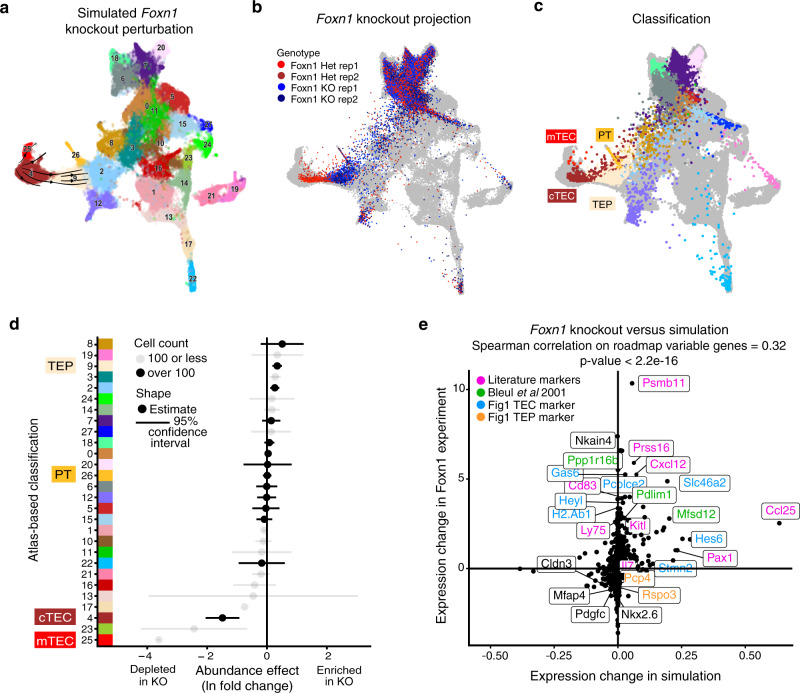
Fig. 5. Foxn1 knockout validates GRN models of thymus development and shows transcriptomic effects highly similar to a developmental block.
a Visualization of an inducible Foxn1 knockout as simulated by CellOracle. Changes in gene expression between the simulated knockout and atlas cells are displayed as velocity streams on the UMAP embedding using scVelo. b, c UMAP visualizations of Foxn1 KO (n = 2) and heterozygous control (n = 2) data overlaid on the scRNA pharynx atlas. Each dot is one cell. Gray cells correspond to scRNA pharynx atlas. Colored cells are from the Foxn1 experiment, with color representing sequencing library (red, Foxn1 Het; blue, Foxn1 KO) (b) or classification (see Supplementary Fig. 3 for cluster color labels) (c). Classification and UMAP embedding of Foxn1 KO cells was done via nearest neighbors. d Cell-type-specific abundance effects due to Foxn1 KO. Clusters and colors are taken from the classifier results in (c). Dots show the log fold change in abundance, and lines show a 95% asymptotic confidence interval based on quasi-Poisson regression. Clusters with fewer than 100 total cells are shown in gray. e Gene-by-gene comparison of the estimated log2-fold change from the Foxn1 KO experiment and the corresponding change predicted by the Foxn1 knockout simulation showing known and scRNA atlas identified thymus-specific genes.

