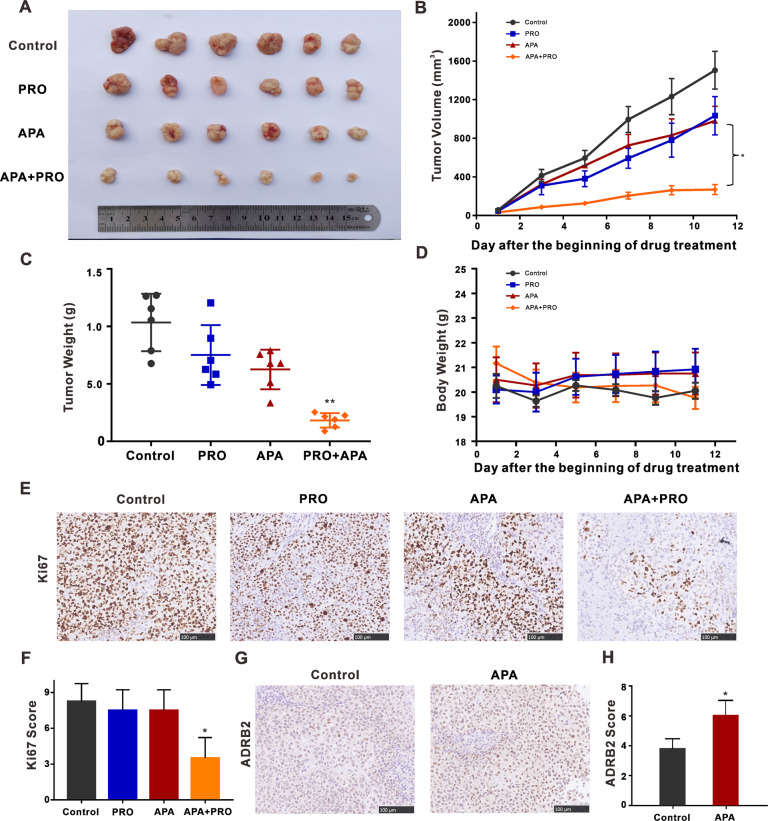
Fig. 6. Combined apatinib and propranolol treatment significantly decreases H460-xenograft growth in vivo.
A Mice were grouped for treatment with 0.9% normal saline group, apatinib (50 mg/kg/day), propranolol (40 mg/kg/day), or both modalities by intragastric injection during the study. Tumors were dissected from nude mice. The inset picture shows the tumor in the respective group. B The growth curve of tumor volume was shown. The data represent mean tumor volumes ± SEMs. C Tumor weight of four groups was compared on the last day. The tumor volumes and weights were presented as means ± SDs (n = 6 for each group). D Body weight changes of mice during drug administration. The data were presented as the mean of tumor volumes ± SEMs. E Immunohistochemistry staining of Ki67 of tumor sections in each group. F IHC score of Ki67 staining. Pictures were captured at a light microscope with ×20 magnifications. (compared with apatinib) G ADRB2 immunohistochemical staining of lung tumors in each group. H IHC score of ADRB2 staining. Pictures were captured at a light microscope with ×20 magnifications. (*P < 0.05, **P < 0.01, compared with control).

