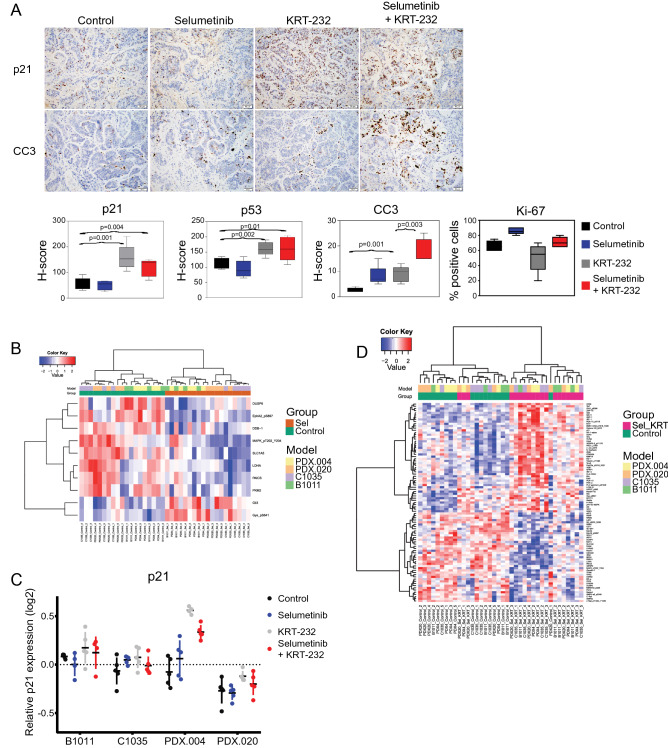
Figure 5.
Selumetinib combined with KRT-232 induces apoptosis in vivo. (A) IHC analysis of PDX.004 CRC tumor samples obtained from the control, selumetinib, KRT-232, or combination treatment groups. (200 × magnification). Box plots of in vivo IHC H-score of p21, p53, and cleaved caspase 3 (CC3), and percentage of Ki-67–positive tumor cells. Values represent mean ± SD. Statistical significance was determined using the Student’s t-test. (B) Heatmap generated (with false discovery rate [FDR] 0.05) from RPPA samples obtained from selumetinib-only treated PDXs vs untreated controls demonstrated 10 differentially expressed proteins (DEPs), where samples were clustered by the treatment. (C) Scatter plot created from RPPA samples obtained from the control, selumetinib, KRT-232, or combination treatment groups demonstrating the relative expression of p21. Bars show mean ± SD. (D) Heatmap generated (with FDR 0.05) from RPPA samples obtained from PDXs treated with selumetinib plus KRT-232 vs untreated controls demonstrated 91 DEPs; samples were clustered by treatment.

