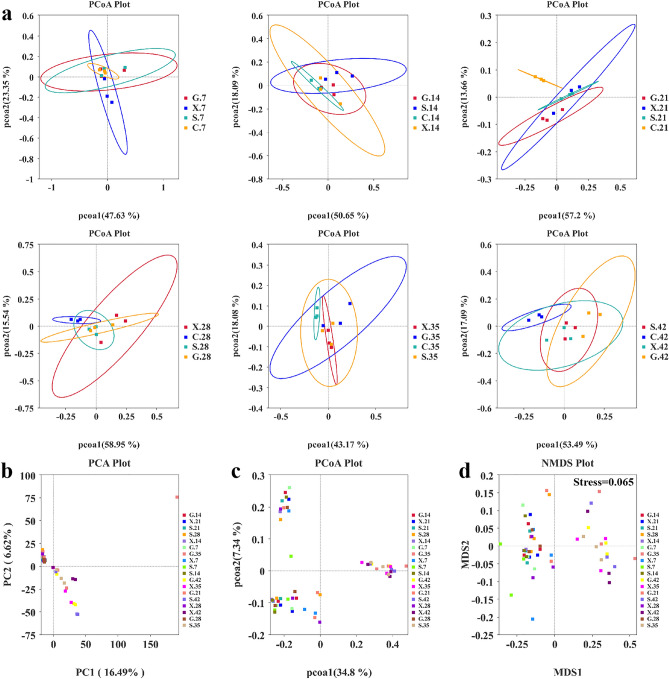
Figure 4.
Alterations in gut microbiota caused by T. gondii infection. (a) PCoA of the weighted UniFrac values for the C, G, S and X group on 7 dpi, 14 dpi, 21 dpi, 28 dpi, 35 dpi and 42 dpi. (b) PCA and (c) PCoA of the unweighted UniFrac values for the G, S and X groups at 7 dpi, 14 dpi, 21 dpi, 28 dpi, 35 dpi and 42 dpi. (d) NMDS plot showing the differences in gut microbiota composition based on the unweighted UniFrac distance. A stress < 0.2 means that the NMDS plot can accurately reflect differences among samples.

