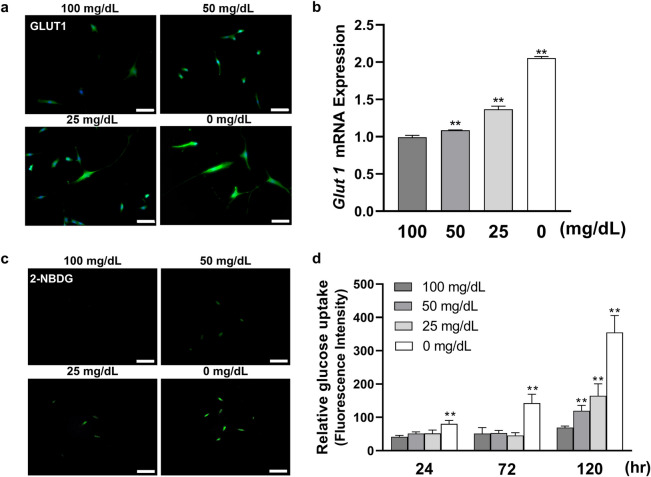
Figure 4.
Low glucose concentrations improved glucose uptake capability on HGnFs. (a and b) The gene expression of GLUT1 was determined using PCR in stimulated HGnFs incubated for 72 h. HGnFs were photographed by a fluorescence microscope after being incubated with fluorescently labeled secondary antibody, and the nuclei were dyed with DAPI. (c and d) The capability of glucose uptake was measured by glucose uptake assay. After 24, 72 and 120 h of incubation, HGnFs were exposed to a medium with 100 μM 2-NBDG for 2 h, and the intensity of fluorescence was measured by a microplate reader and normalized by DNA. The stained cells were photographed by a fluorescence microscope. (Scale bars: 100 μm; A significant increase compared with the control was described as **P < 0.01).

