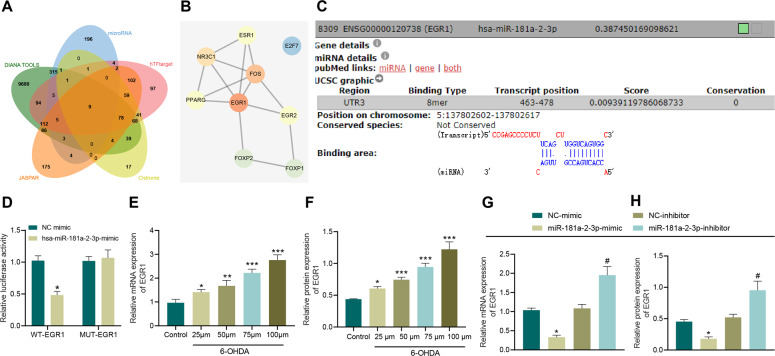
Fig. 4. miR-181a–2–3p targets EGR1.
A The downstream genes of miR-181a–2–3p predicted using DIANA TOOLS and mircroRNA and Venn map of the human transcription factor obtained from hTFtarget, Cistrome and JASPAR. B The interaction network of proteins of 9 important transcription factors constructed by String. Red represents the higher core degree, and blue represents the lower core degree. C The binding sites between miR-181a–2–3p and EGR1 predicted using DIANA TOOL. D The binding of miR-181a–2–3p to EGR1 using dual-luciferase assay. E EGR1 mRNA level in SH-SY5Y cells treated with 6-OHDA determined using RT-qPCR. F Western blot analysis of EGR1 protein level in SH-SY5Y cells treated with 6-OHDA. G EGR1 mRNA level in SH-SY5Y cells treated with miR-181a–2–3p mimic or inhibitor determined using RT-qPCR. H Western blot analysis of EGR1 protein level in SH-SY5Y cells treated with miR-181a-2-3p mimic or inhibitor. *p < 0.05 vs. NC mimic or *p < 0.05, **p < 0.01, ***p < 0.001 vs. SH-SY5Y cells without treatment; #p < 0.05 vs. NC inhibitor. Cell experiments were repeated three times independently.

