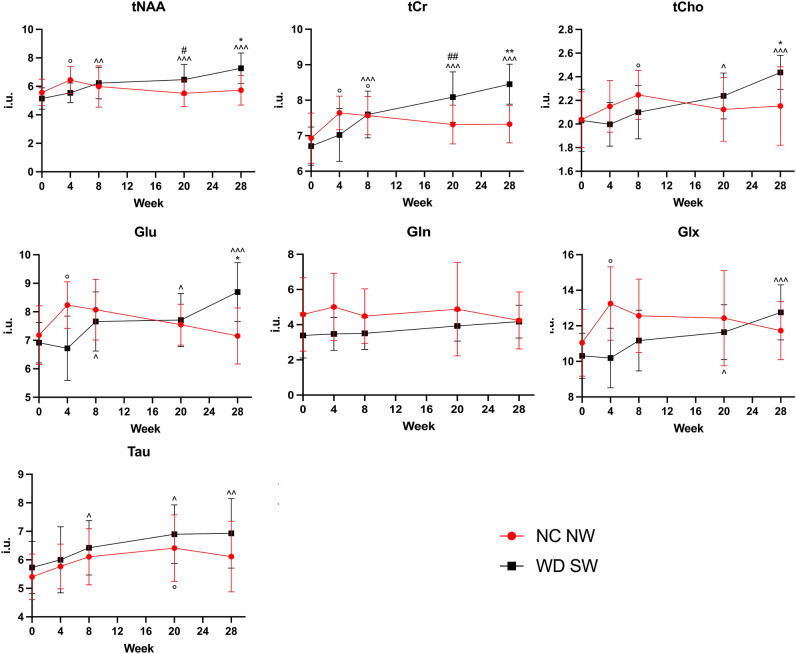
Figure 7.
Concentration values of the metabolites for NC NW (red) and WD SW (black) mice during the 28 weeks investigated. The results are expressed as mean ± S.D. *: p < 0.05, **: p < 0.01 vs NC NW T4; #: p < 0.05, ##: p < 0.01 vs NC NW T3; ^: p < 0.05, ^^: p < 0.01, ^^^: p < 0.001 vs WD SW T0; °: p < 0.05 vs NC NW T0. i.u.: institutional units. NC NW: Normal Chow Normal Water, WD SW: Western Diet Sugar Water; T0: 0 weeks, T1: 4 weeks, T2: 8 weeks, T3: 20 weeks, T4: 28 weeks. tNAA, total N-acetylaspartate; tCr, total creatine; tCho, total choline; Glu, glutamate; Gln, Glutamine; Glx, glutamate + glutamine; Tau, Taurine.

