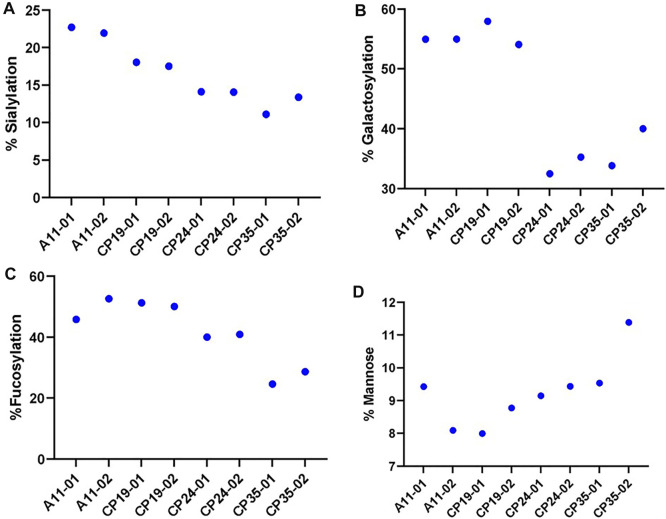
FIGURE 3.
The relative levels of various glycan attribute. (A) Sialylation, (B) Galactosylation, (C) Fucosylation and (D) Mannose content for four different CHO clones (A11, CP19, CP24, and CP35) expressing VRC01 mAb in a 12 days long fed-culture. The suffix 01 and 02 represents the biological replicates for each of the clone.

