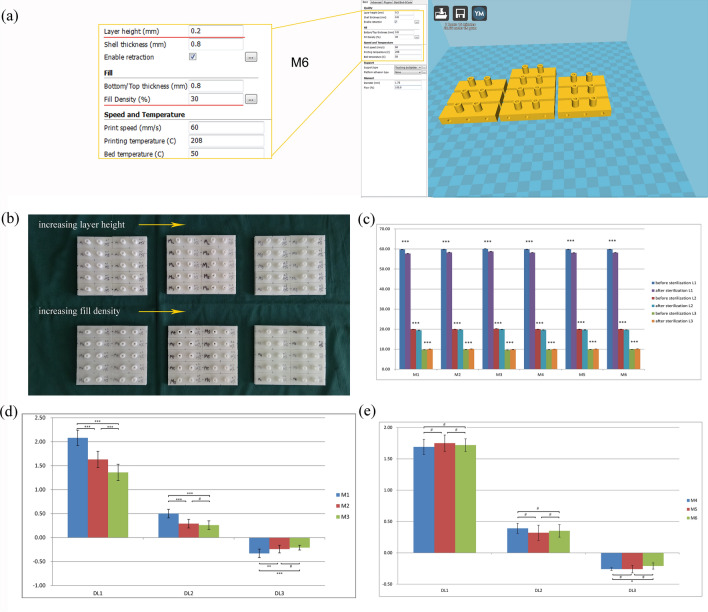
Figure 3.
Changes of M series modules before and after EO sterilisation: (a) settings of the Cura software, only layer height and infill density were changed; (b) measuring points and parameter settings of the M series; (c) There are significant statistical differences in the dimension of each module before and after sterilisation; (d) analysis of the differences in dimensional changes between M1, M2, and M3 modules after sterilisation based on layer height; (e) analysis of the differences in dimensional changes between M4, M5, and M6 modules after sterilisation based on infill density. Values are the means ± SD, n = 10. #p > 0.05, *p < 0.05, **p < 0.01, and ***p < 0.001 suggests a statistically significant difference between the indicated groups. DLn = Ln (pre-sterilisation)-Ln(post-sterilisation), n = 1, 2, and 3.

