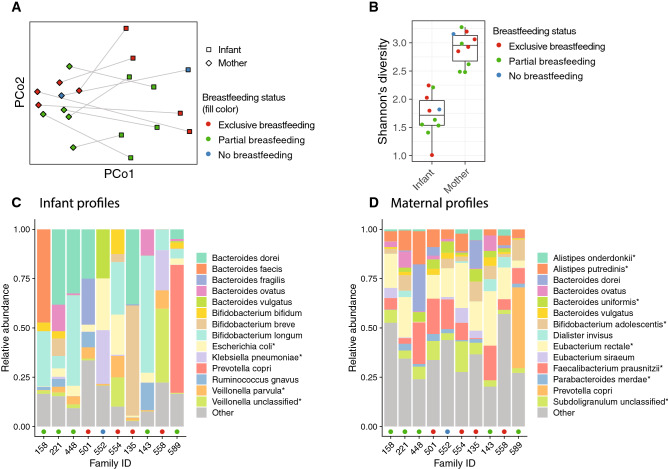
Figure 1.
Distinctive microbial profiles separated infants from their mothers. (A) Principal Coordinate Analysis ordination of bacterial taxonomic profiles. Samples from the same family are connected by line. (B) Shannon’s diversity of microbial species profiles. The box of the boxplot shows the interquartile range, whiskers show the range of data and horizontal line in the box shows the median. (C–D) Relative abundances of the 14 most abundant species (on average) in the infant (C) and maternal (D) stool samples. Coloured points on the x-axis indicate breastfeeding status as on panel B.

