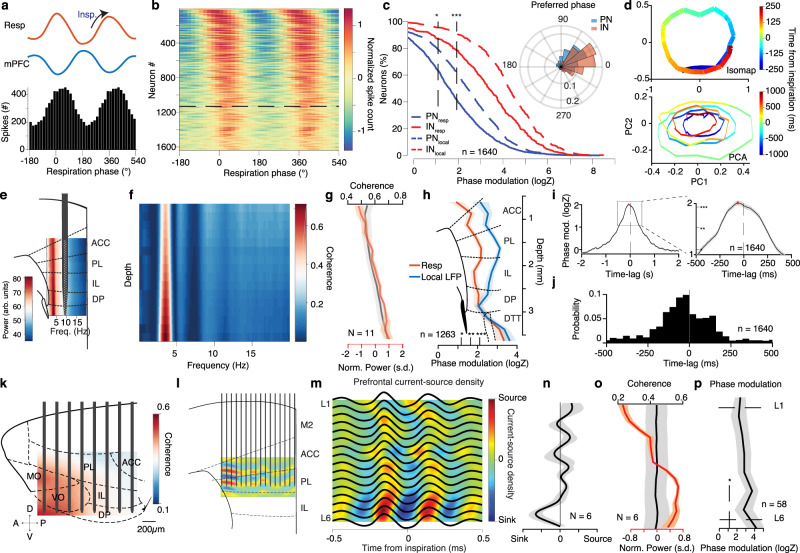
Fig. 2. Topography of prefrontal circuit entrainment by breathing.
a Example respiration phase histogram. Top, average respiration (red) and mPFC LFP (blue) traces. b Color-coded phase histograms of all prefrontal neurons (n = 1640 neurons, N = 13 mice). Horizontal line: significance threshold. c Cumulative distribution of the logZ for all prefrontal PNs (blue, n = 1250 neurons) and INs (red, n = 390 neurons) in relation to respiration (solid lines) and local LFP (vertical dashed lines). Inset: Distribution of the preferred phase for PNs (blue) and INs (red). d Example Isomap (top) and PCA (bottom) trajectories of the mPFC population activity triggered on inspiration. e Schematic of a silicon polytrode in the deep layers of the mPFC, overlaid on an example depth- and frequency-resolved power spectrum spanning all mPFC subregions. f Example depth- and frequency-resolved coherence between respiration and local prefrontal LFP. g Average depth-resolved power (red) and coherence in the 2–5 Hz band (black) (N = 11 mice). h Depth-resolved spike phase modulation statistics (logZ) (as in (c)) (n = 1263 cells, N = 11 mice). i Time-lagged phase modulation of prefrontal population, indicative of directionality from respiration to prefrontal activity. Peak lag is −65ms. j Time-lag distribution for the prefrontal population (n = 1640 neurons, N = 13 mice). k Example 2D coherence throughout the frontal subregions. l Schematic of a translaminar recording from the mPFC using a 16-shank probe (50 μm spacing) and example inspiration-triggered CSD profile. m Example average inspiration-triggered LFP traces and overlaid corresponding translaminar CSD from the mPFC. n Average inspiration-triggered translaminar normalized CSD from the mPFC (N = 6). o Average laminar profile of the 2–5 Hz band LFP power (red) and coherence with respiration (coherence) (N = 6). p Laminar unit phase modulation statistics (logZ) (n = 58 cells, N = 6). Shaded areas, mean ± SEM, arb. units arbitrary units, s.d. standard deviations, Insp inspiration, ACC anterior cingulate, PL prelimbic, IL infralimbic, DP dorsal peduncular, MO medial orbital, VO ventral orbital, L1 layer 1, L6 layer 6. Stars indicate significance levels (*P < 0.05; **P < 0.01; ***P < 0.001).

