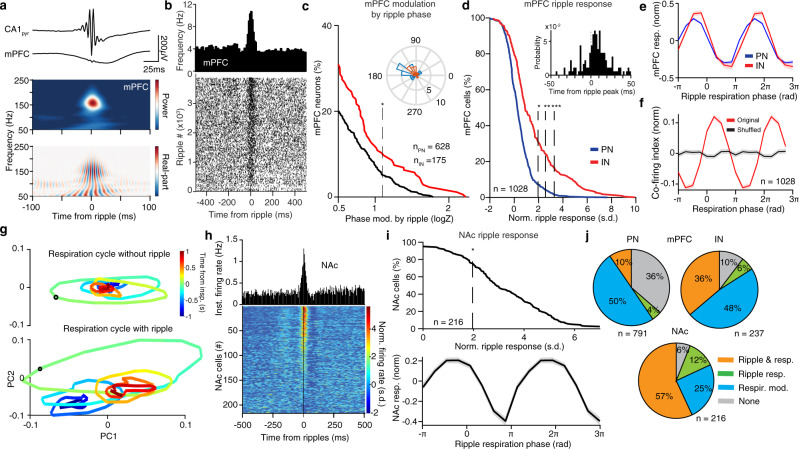
Fig. 8. Breathing modulates the cortico–hippocampal interaction.
a Example is ripple-triggered CA1pyr and mPFC LFP traces and wavelet spectral decomposition of mPFC LFP power (upper) and real part (lower) (n = 3162 ripples). b Example mPFC unit spiking across ripples (bottom) and cross-correlogram of unit firing to ripple occurrence (top). c Cumulative distribution of the modulation strength by ripple oscillation phase for all mPFC PNs (n = 628 cells) and INs (n = 175 cells). Inset, preferred phase distribution for all significantly phase-modulated cells. d Cumulative distribution of the ripple-triggered firing of mPFC PNs (n = 791 cells) and INs (n = 237 cells) in response to ripples (N = 11 mice). Inset, distribution of relative time of peak firing. e Prefrontal ripple-evoked response for PN (blue traces) and IN (red traces), as a function of the breathing phase of occurrence of ripple. f Co-firing index for all pairs of dCA1 and mPFC cells (n = 14,412, N = 13 mice) compared to shuffle control. g Example trajectory of the mPFC population dynamics around inspiration without (top) and with (bottom) a ripple oscillation occurring during that period in the oscillation. Black circle denotes time 0, pseudocolor codes for the time from inspiration onset. h Cross-correlation of firing with respect to ripple time for one example NAc unit (top) and color-coded cross-correlograms for all NAc cells (n = 216 cells). i Top, cumulative distribution of the ripple-triggered normalized firing of NAc cells (n = 216 cells) in response to ripples (N = 4 mice). Bottom, ripple-evoked response as a function of the breathing phase of occurrence of ripple. j Top, pie charts indicating the percentage of all mPFC PNs (left; n = 791 cells) and INs (right; n = 237 cells) that are either phase modulated by respiration (resp. mod), responding significantly to ripples (ripple resp.), being both significantly modulated by breathing and significantly responsive to ripples or neither. Bottom, similarly, for all NAc cells (n = 216 cells). s.d. standard deviations, arb. units arbitrary units. Shaded areas, mean ± SEM. Stars indicate significant phase modulation levels (*P < 0.05; **P < 0.01; ***P < 0.001).

