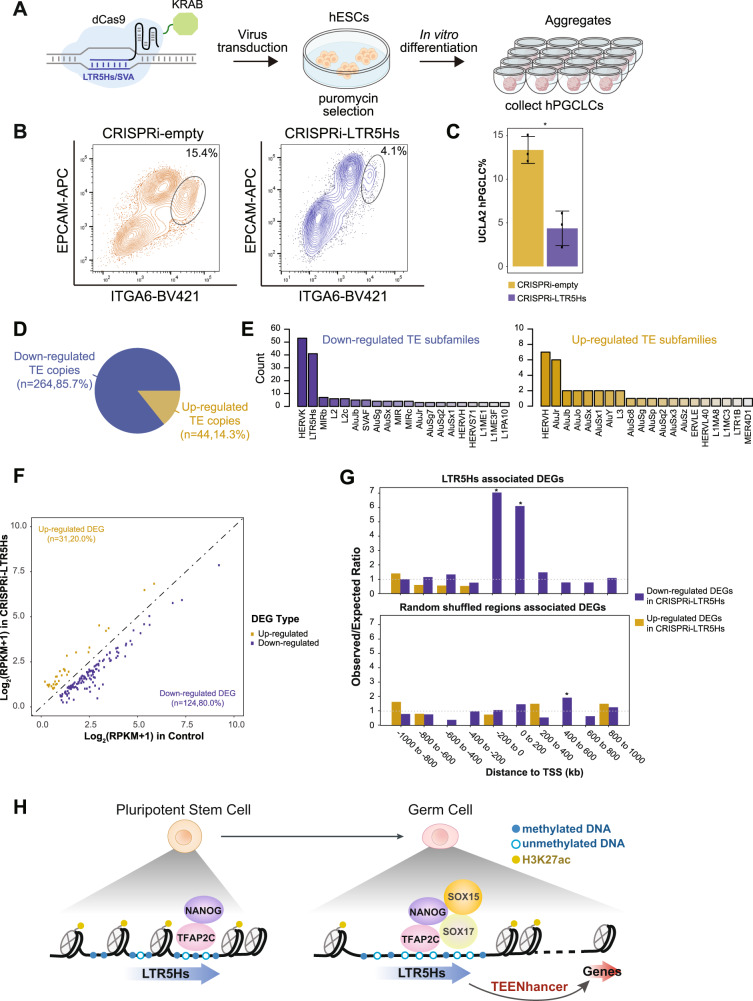
Fig. 5. Inactivation of LTR5Hs TEENhancers leads to less hPGCLC formation.
A Schematic illustration depicting transduction of dCas9-KRAB-gRNAs targeting LTR5Hs in hESCs followed by hESCs differentiation to hPGCLCs. B Representative flow cytometry plots for hPGCLC differentiating from CRISPRi-LTR5Hs and CRISPRi-empty in UCLA2 hESC lines. The black circles denote the hPGCLC population as defined by ITGA6/EPCAM double-positive cells. C Barplot showing the percentage of hPGCLCs in CRISPRi-empty relative to CRISPRi-LTR5Hs groups in UCLA2 (biological replicates n = 3; *p-value = 0.0042; error bars showing mean ± SEM). D Pie chart showing up- or down-regulated DETE copies in CRISPRi-LTR5Hs compared with CRISPRi-empty controls, as defined by at least a 4-fold change in expression and FDR <0.05. E Barplot of the TE subfamilies with the most up- or down-regulated DETE copies. F Scatterplot of the expression level for identified up- or down-regulated DEGs in CRISPRi-LTR5Hs compared with CRISPRi-empty control, using a cut-off of least 1.5-fold change in expression and a FDR of <0.05. G RAD analysis for the association between LTR5Hs (upper panel) or random shuffled regions (lower panel) with CRISPRi-LTR5Hs DEGs. *p-value < 0.05, two-sided Welch Two Sample t-test. H Proposed model for the role of LTR5Hs as TEENhancers in PGC specification. Source data underlying C and G are provided as a Source Data file.

