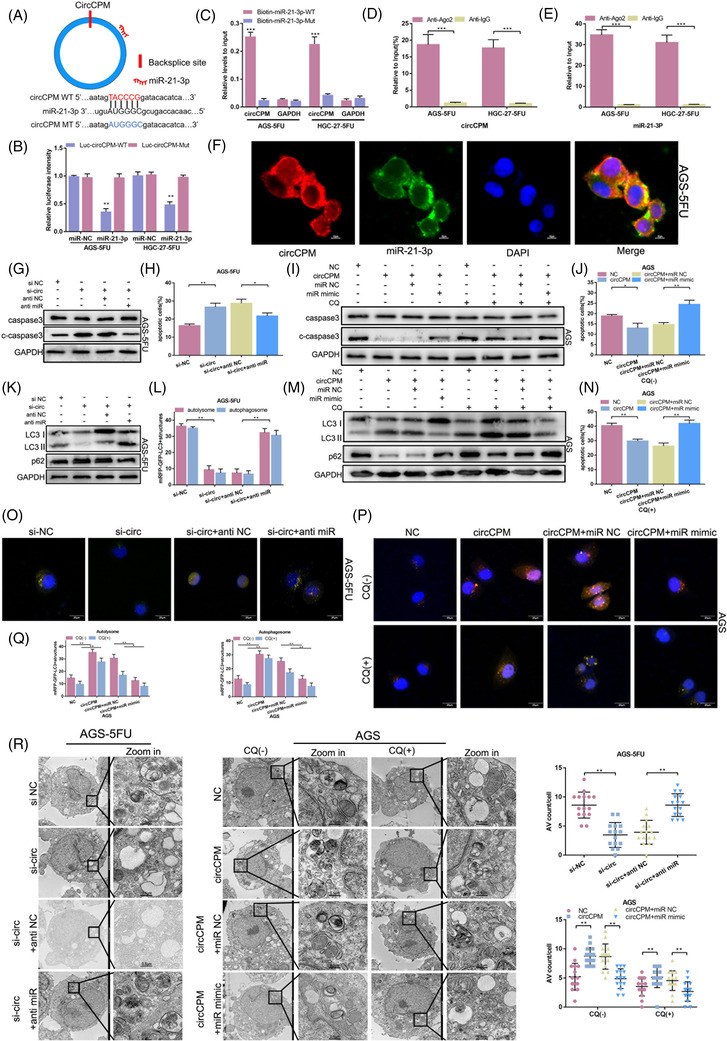
FIGURE 4.

Circular CPM (CircCPM) functions as a sponge of miR‐21‐3p in gastric cancer (GC). (A) Schematic illustration of the predicted miR‐21‐3p binding sites on circCPM. (B) A luciferase reporter assay was used to detect the binding ability of circCPM and miR‐21‐3p in AGS‐5FU and HGC‐27‐5FU cell lines. (C) The biotinylated wild‐type/mutant miR‐21‐3p was transfected into AGS‐5FU and HGC‐27‐5FU cell lines with circCPM overexpression. The circCPM levels were examined by qRT‐PCR after capture. (D and E) RNA binding protein immunoprecipitation (RIP) assays were performed to assess the binding ability of miR‐21‐3p or circCPM and AGO2. (F) Fluorescence in situ hybridization (FISH) showed that circCPM and miR‐21‐3p were co‐localized in the cytoplasm in AGS‐5FU cells. The nucleus staining with 4,6‐diamino‐2‐phenyl indole (DAPI) (blue). (G and K) Western blot analysis of caspase3, c‐caspase 3, LC3 and p62 in AGS‐5FU transfected with si‐circ or co‐transfected with anti‐miR upon 5‐FU exposure (25 μM 48 h). (I and M) Western blot analysis of caspase3, c‐caspase 3, LC3 and p62 in AGS transfected with circCPM overexpression vector or co‐transfected with miR mimic upon 5‐FU exposure (5μM for 48h). (H) Apoptotic assays of AGS‐5FU cells transfected with si‐circ or co‐transfected anti‐miR upon 5‐FU exposure (25 μM 48 h). (J and N) Apoptotic assays of AGS cells transfected with circCPM overexpression vector or co‐transfected with miR mimic upon 5‐FU (5 μM 48 h) and/or chloroquine (CQ) (20 μM 24 h) exposure. (L and O) Immunofluorescence analysis of AGS‐5FU transfected with si‐circ or co‐transfected anti‐miR upon 5‐FU exposure (25 μM 48 h). Scale bar 20 μm. (L) Quantification data of autolysosome and autophagosome in AGS‐5FU. (P and Q) Immunofluorescence analysis of AGS transfected with si‐circ or co‐transfected anti‐miR upon 5‐FU (5 μM 48 h) and/or CQ (20 μM 24 h) exposure. Scale bar 20μm. (P) Quantification data of autolysosome and autophagosome in AGS. (R) Transmission electron microscopy (TEM) images of AGS‐5FU and AGS with specific treatments. Right upper panel: Quantification data of autophagic vacuoles (AV) counts in AGS‐5FU transfected with si‐circ or co‐transfected anti‐miR upon 5‐FU exposure (25 μM 48 h). Right lower panel: Quantification data of AV counts in AGS transfected with si‐circ or co‐transfected anti miR upon 5‐FU (5 μM 48 h) and/or CQ (20 μM 24 h) exposure. The number of AV of 15 cells was counted in each section. Scale bar = 2 μm or 0.5 μm. (Graph represents mean ± SD; *p < .05, **p < .01 and ***p < .001)
