Fig. 1.
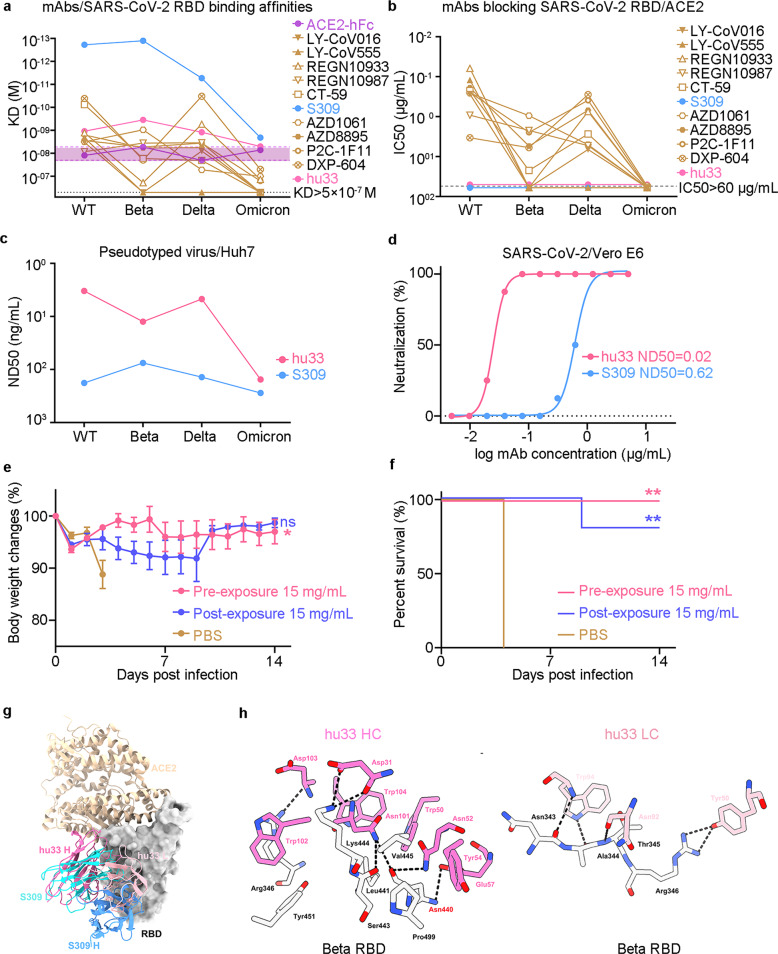
Non-ACE2-blocking mAb hu33 broadly neutralizing SARS-CoV-2 and Omicron variant. a Binding affinities of ACE2 or mAbs/SARS-CoV-2 RBD variants. The purple interval represents the threshold (KD) of ACE2/SARS-CoV-2 RBD variants. mAbs binding to SARS-CoV-2 RBD variants are labeled accordingly. b Blocking assays of mAbs to ACE2/SARS-CoV-2 RBD variants. The EC50s were calculated by fitting OD450 values from the serially diluted antibody to a sigmoidal dose-response curve. The data presented in (a, b) are one representative result from three independent experiments. c Pseudovirus neutralization analysis of mAbs. SARS-CoV-2 or variants pseudovirus was incubated with serially diluted hu33 or S309. The mixtures were then added to Huh7 cells. ND50 values were calculated by fitting the luciferase activity from serially diluted antibody to a sigmoidal dose-response curve. d Authentic SARS-CoV-2 neutralization analysis of mAbs. Mixtures of live SARS-CoV-2 virus and serially diluted hu33 or S309 were added to Vero E6 cells. After a 72-h incubation, ND50 values were calculated by fitting the proportion of cytopathic effect with serially diluted antibody to a sigmoidal dose-response curve. One set of representative data is shown in (c) and (d). e, f Groups of 8-week-old hACE2 mice (n = 5) were infused with 15 mg/kg mAb hu33 or placebo as a control. Changes of body weight (e) and survival curves (f) of mice in 2 weeks later by challenging with SARS-CoV-2 virus. Error bars denote SEM (standard error of the mean) of the mean. P values were analyzed with ordinary one-way ANOVA in (e) (ns p > 0.05, and *p < 0.05). P values were calculated using the Mantel-Cox test in comparison with that of the PBS-treated group in (f) (**p < 0.01). g Superimposition of the hu33/SARS-CoV-2 Beta RBD complex (PDB code:7WBH), S309/SARS-CoV-2 RBD (PDB code: 6WPT), and ACE2/SARS-CoV-2 RBD (PDB code: 6LZG) reveals the no stereo-specific competition between NAbs and ACE2. SARS-CoV-2 RBD is shown as surface (gray). hu33-Fab (pink/violet), S309-Fab (blue/cyan), and ACE2 (wheat) are displayed as a cartoon. h The binding details between hu33 and Beta RBD are presented with amino acids from VL and VH which forms hydrogen bond interactions with amino acids from Beta RBD. The hydrogen bonds are shown as dashed black lines

