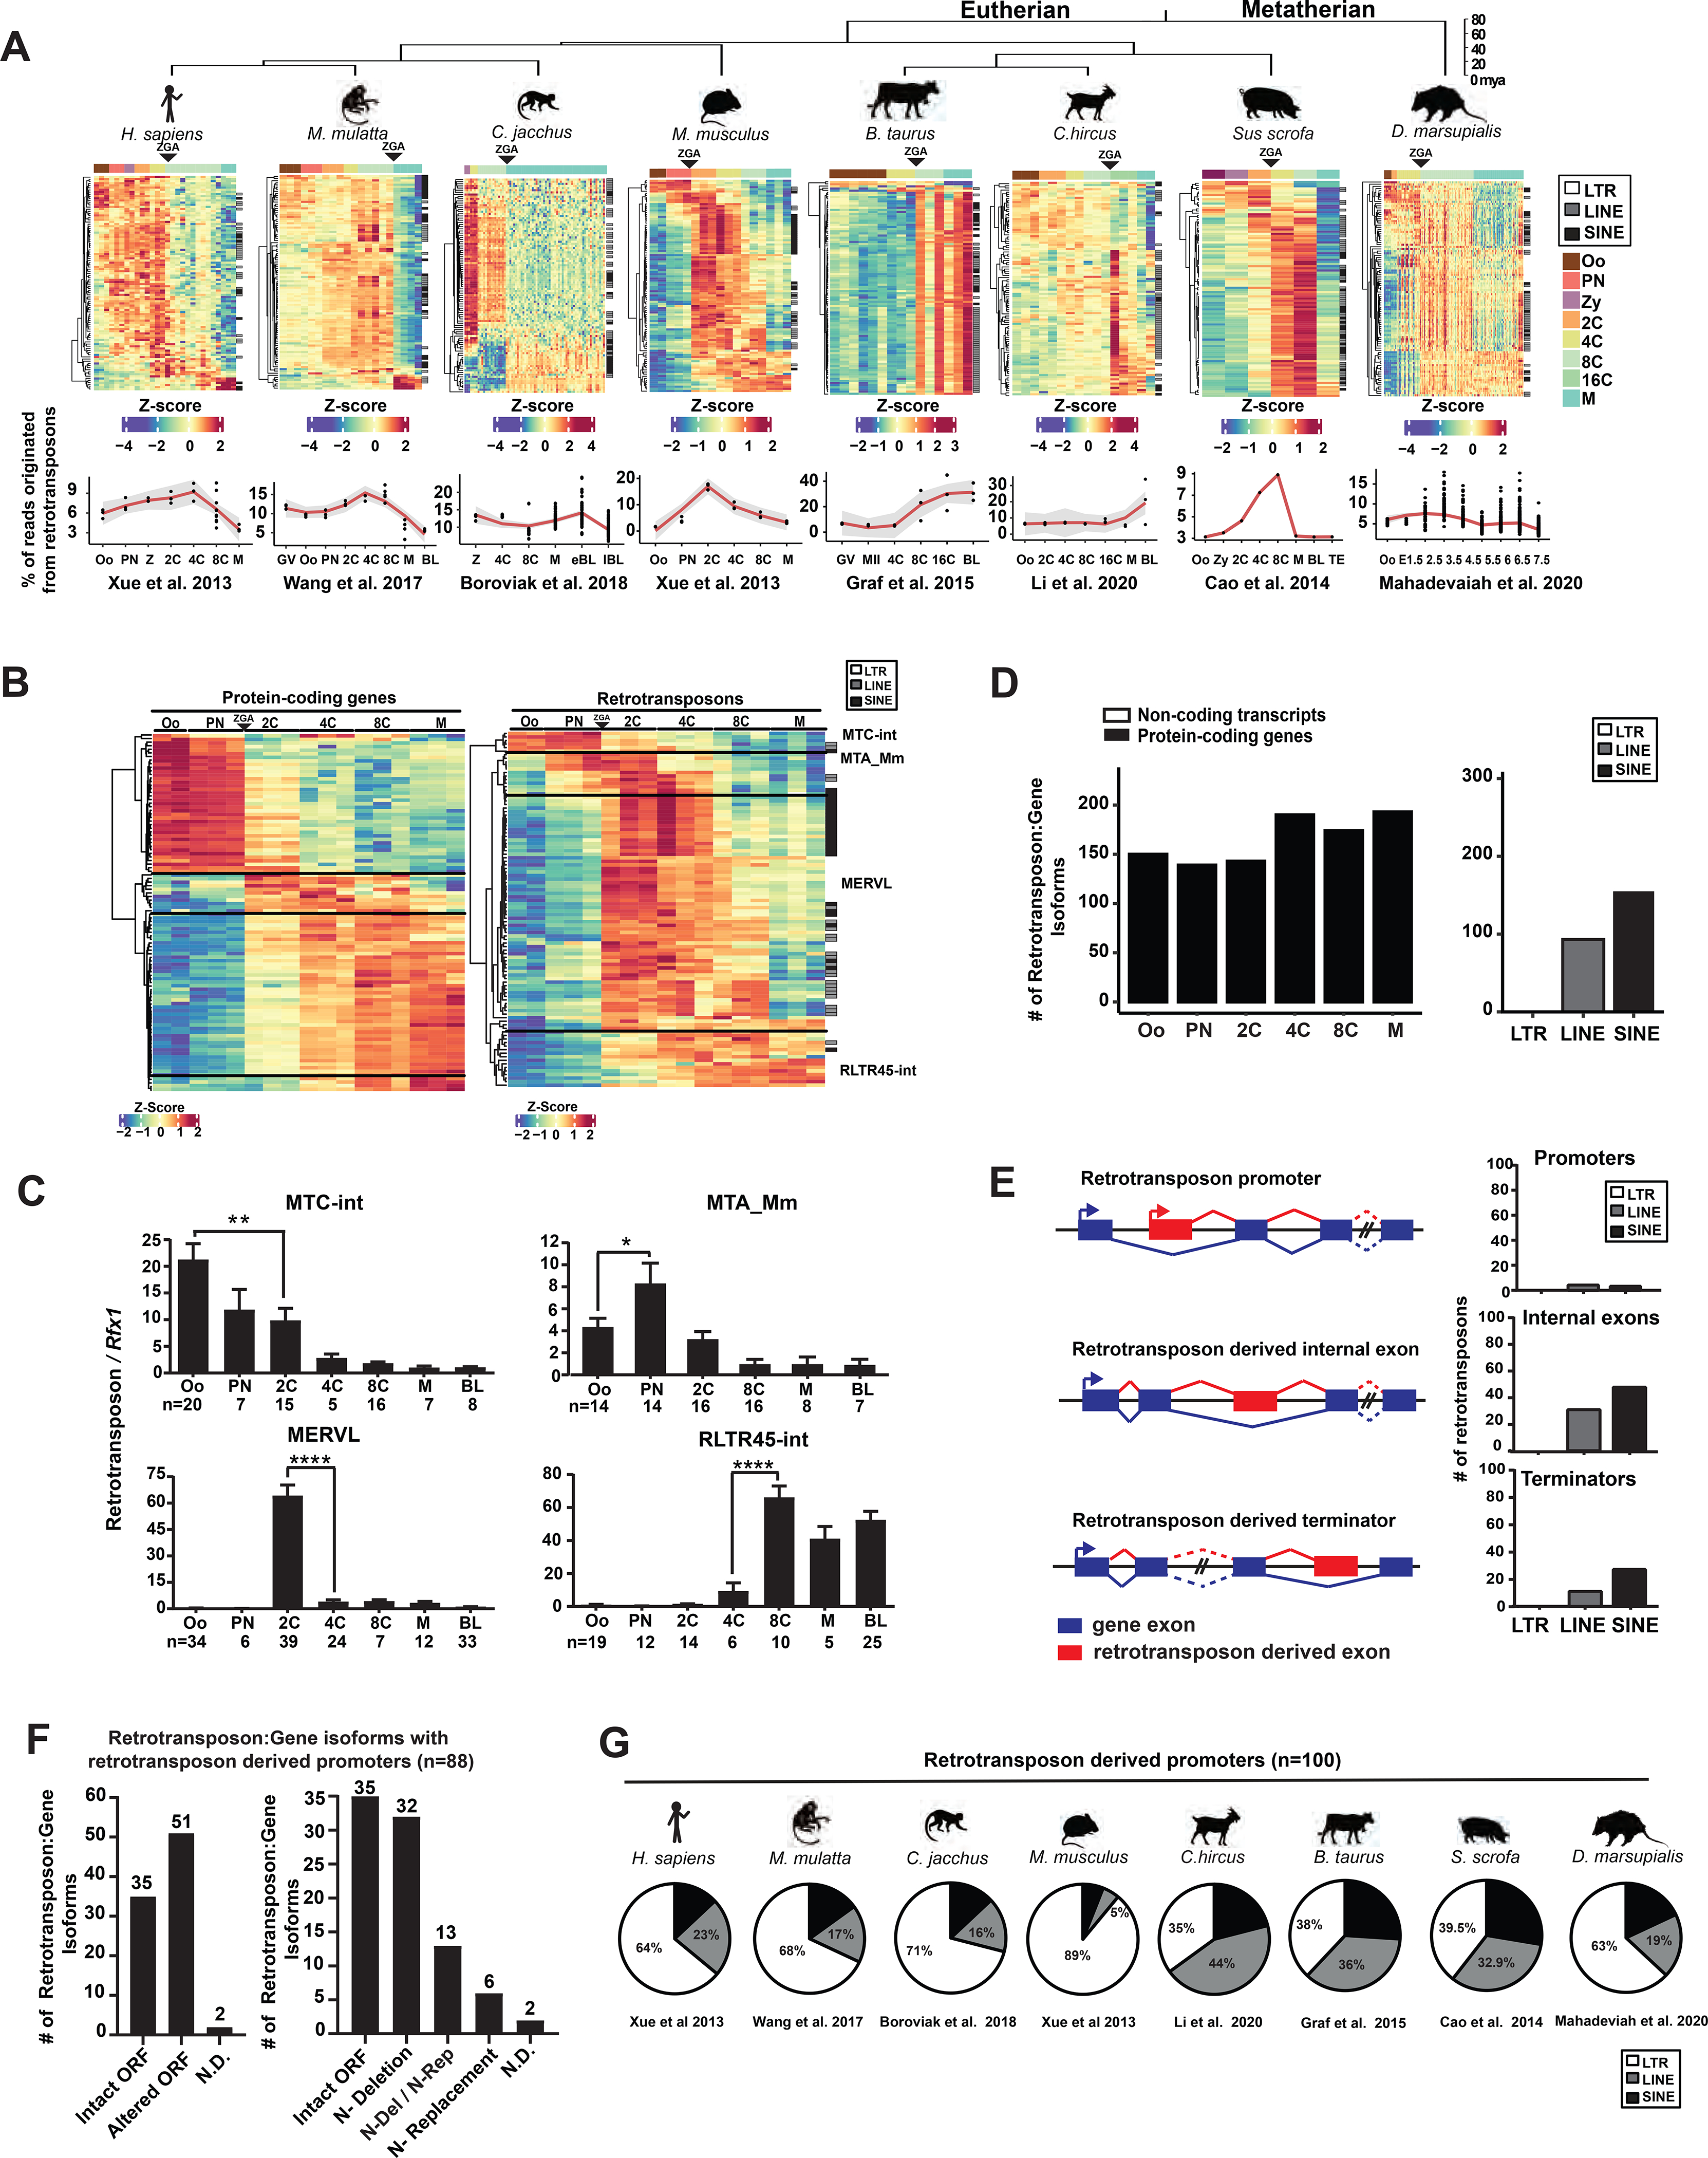
Figure 1. Retrotransposons mediate gene regulation in mammalian preimplantation development.

A. Retrotransposons are highly and dynamically expressed in preimplantation embryos across mammals. RNA-seq data from each species were subjected to TEtranscripts analyses to quantify the number of mappable RNA-seq reads at protein-coding genes, non-coding transcripts and retrotransposons. For each species, a heatmap exhibits the preimplantation profile of the top 100 most highly and differentially expressed retrotransposon subfamilies, and line graphs show the percentage of transcriptome from retrotransposon loci. B. TEtranscripts analyses revealed similar profiles of retrotransposon and protein-coding gene in mouse preimplantation embryos, as shown by the heatmap of the top 100 most highly and differentially expressed protein-coding genes (left) and retrotransposon subfamilies (right). Four distinct patterns emerged. A, B. Z-score, the number of standard deviations from the expression mean of a retrotransposon subfamily or a protein-coding gene. Oo, oocyte; Zy, zygotes; PN, pronucleus; 2C, two cell embryo; 4C, four cell embryo; 8C, eight cell embryo; 16C, sixteen cell embryos; M, morula; BL, blastocysts. C. Single embryo real time PCR analyses confirm the dynamic expression patterns of four representative retrotransposon subfamilies. Error bars, ± s.e.m. P values were calculated using unpaired, two-tailed Student’s t test. (MTC-int, Oo vs. 2C, **P = 0.009, t=2.8, df=33 MTA_Mm, Oo vs. PN, *P = 0.04 t=2.1, df=26; MERVL, 2C vs. 4C, ****P < 0.0001 t=7.4, df=62; RLTR45-int, 4C vs 8C, ****P < 0.0001 t=5.2, df=16). D. Preimplantation-specific, retrotransposon:gene splicing junctions preferentially associate with protein-coding genes in preimplantation embryos. Retrotransposon:gene isoforms of GENCODE annotated protein-coding genes (black) and non-coding transcripts (white) are shown as bar plots for all preimplantation stages (left). Retrotransposon:gene isoforms containing LTR, LINE or SINE retrotransposons are each quantified (right). Only highly expressed retrotransposon:gene splicing junctions (an average of ≥ 30 reads across preimplantation stages) are included in these analyses. E. Retrotransposons mediate gene regulation as alternative promoters, internal exons and terminators for proximal gene isoforms (left). The top 250 most highly and differentially expressed retrotransposons that yield gene promoters (TSS within retrotransposon), internal exons and terminators were classified by LTRs, LINEs and SINEs (right). F. Retrotransposon promoters frequently drive gene isoforms with N-terminally altered ORFs. Among the 250 most highly and differentially expressed retrotransposon:gene isoforms in mouse preimplantation embryos, 88 are driven by retrotransposon promoters. Manual curation predicts frequent ORFs alterations caused by retrotransposon promoters (left), which are further classified based on the mechanisms of ORF alteration (right). N-Deletion, predicted N-terminal truncation; N-Replacement, predicted sequence replacement of the protein N-terminus; N-Del/N-Rep, predicted as either N-terminal deletions or N-terminal sequence replacements, due to uncertainty in ATG prediction; N.D., not determined. G. Retrotransposon promoters in mammalian preimplantation embryos are enriched for LTR retrotransposons. The proportion of LTR, LINE or SINE retrotransposons was determined for the top 100 most highly and dynamically expressed retrotransposon promoters in preimplantation embryos of 8 mammalian species. RNA-seq data for 1B, 1D, 1E and 1F analyses were obtained from Xue et al. 2013. All P values were calculated using unpaired, two-tailed Student’s t test. n.s., not significant. See also Figure S1 and Tables S1–S5.
