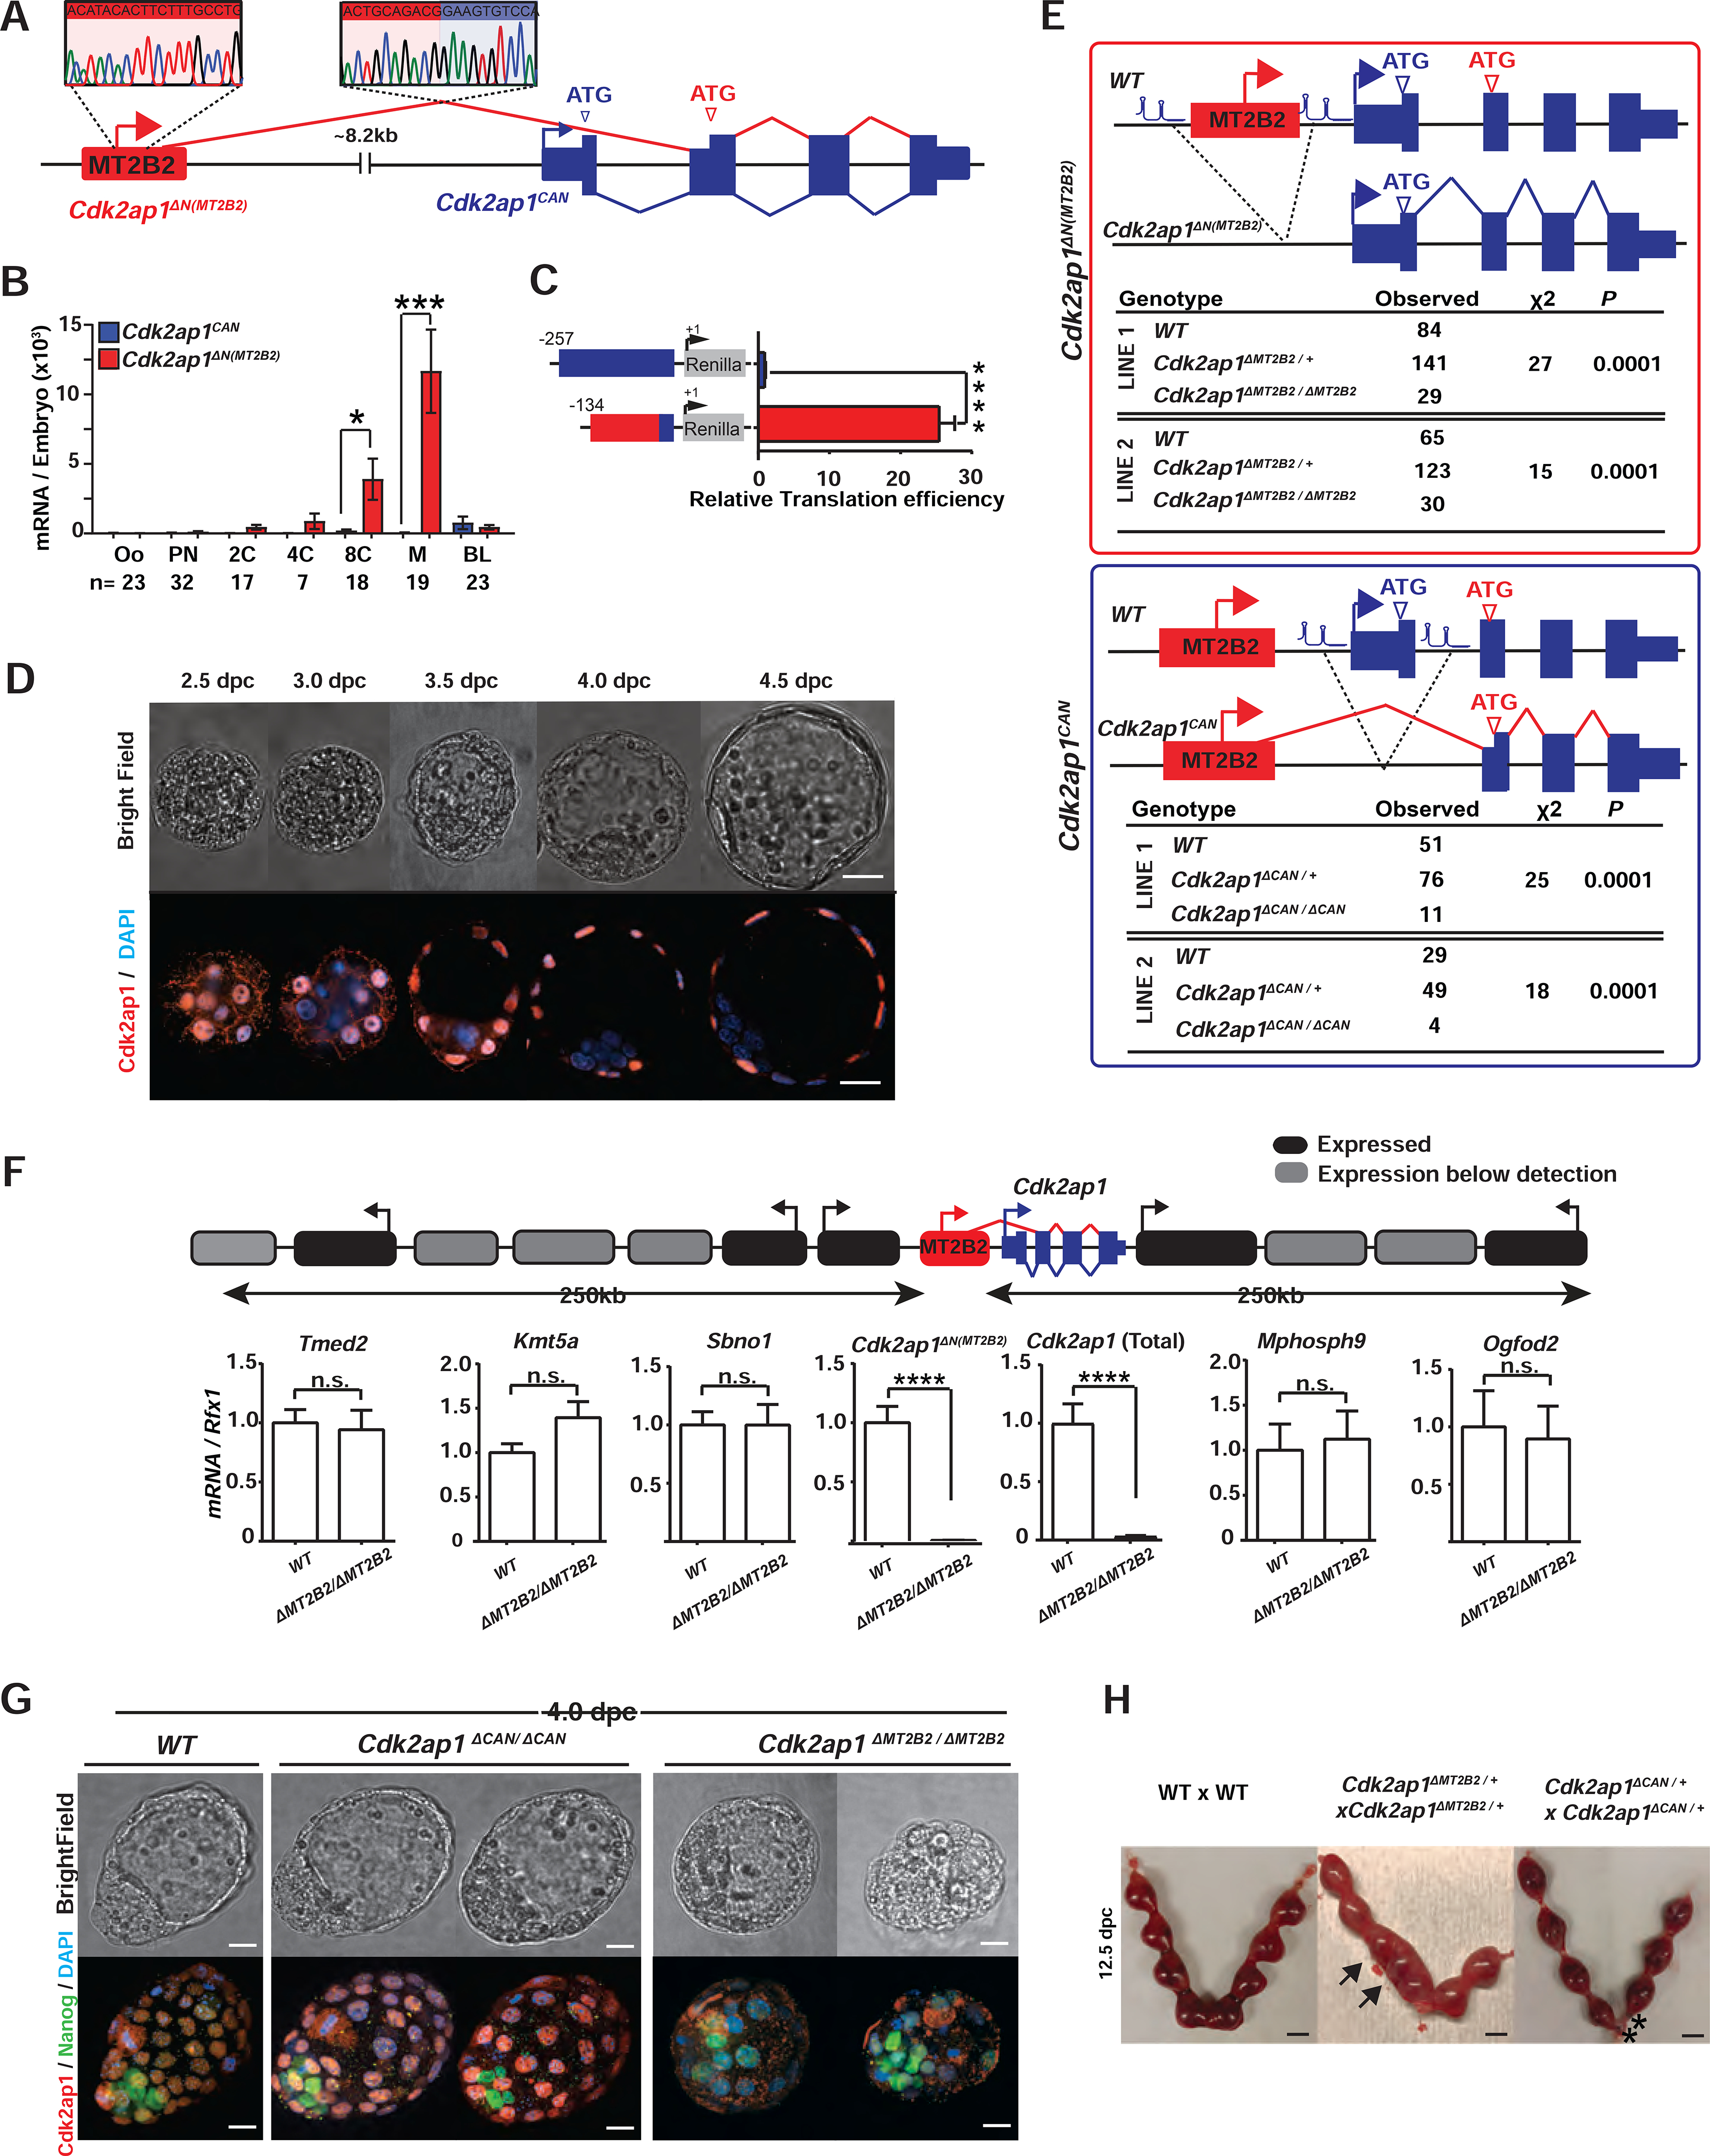
Figure 2. Canonical Cdk2ap1 and MT2B2 driven Cdk2ap1ΔN (MT2B2) differ in function.

A. Diagram illustrates the gene structure of canonical Cdk2ap1CAN (blue) and Cdk2ap1ΔN (MT2B2) (red) isoforms. 5’ RACE confirms TSS within the MT2B2 element; RT-PCR confirms splicing between MT2B2 and Cdk2ap1 exon 2. B. Absolute real-time PCR quantification of single embryos compares the level of Cdk2ap1CAN and Cdk2ap1ΔN (MT2B2). Error bars, s.e.m. Cdk2ap1CAN vs. Cdk2ap1ΔN (MT2B2) at 8C, n=17, *P = 0.02, t=2.5, df=34; Cdk2ap1CAN vs. Cdk2ap1ΔN (MT2B2) at morula, n=19, ***P = 0.0004, t=3.9, df=36. C. MT2B2 derived 5’UTR enhances the translation efficiency of Cdk2ap1ΔN (MT2B2). The 5’UTR of Cdk2ap1CAN or Cdk2ap1ΔN (MT2B2) were each cloned 5’ to a Renilla luciferase reporter to measure its impact on translation in HEK293 cells. The MT2B2 derived 5’UTR was associated with a higher translation efficiency. Three independent experiments were performed in triplicate per condition. Error bars, s.e.m; **** P < 0.0001, t=20.44, df=4. D. Mouse preimplantation embryos between 2.5 dpc to 4.5 dpc were immunostained for Cdk2ap1. Cdk2ap1 protein expresses in the outer cells of morulae and the TE cells in blastocysts. Confocal images are representative of 4 or more embryos per stage. Scale bar, 20μm. E. Diagrams illustrate CRISPR genome engineering strategy for targeted deletion of Cdk2ap1ΔN (MT2B2) (top) and Cdk2ap1CAN (bottom). Mendelian ratios of progenies from Cdk2ap1ΔMT2B2/+ × Cdk2ap1ΔMT2B2/+ crosses (top) or Cdk2ap1ΔCAN/+ × Cdk2ap1ΔCAN/+ crosses (bottom) were documented at postnatal day 10 (p10), demonstrating a significant reduction of viability in both genotypes. Two independent Cdk2ap1ΔMT2B2/ΔMT2B2 and Cdk2ap1ΔCAN/ΔCAN lines were analyzed. F. The MT2B2 deletion specifically abolishes Cdk2ap1ΔN (MT2B2) expression, without impacting any neighboring genes. Age matched wildtype (n=9) and Cdk2ap1ΔMT2B2/ΔMT2B2 (n=7) morula embryos were collected from two independent WT × WT and Cdk2ap1ΔMT2B2/ΔMT2B2 × Cdk2ap1ΔMT2B2/ΔMT2B2 crosses, respectively, and were subjected to single embryo real-time PCR analyses to measure the expression of Cdk2ap1ΔN (MT2B2), total Cdk2ap1 and all neighboring genes with 250 kb of the deletion. Black, expressed genes; grey, genes below detection; error bars, s.e.m. Cdk2ap1 (Total), wildtype (n=3) vs. Cdk2ap1ΔMT2B2/ΔMT2B2 (n=3), ****P < 0.0001, t=16.8, df=4; Cdk2ap1ΔN (MT2B2), wildtype (n=9) vs. Cdk2ap1ΔMT2B2/ΔMT2B2 (n=7), ***P = 0.0002, t=4.9, df=14. G. Cdk2ap1ΔMT2B2/ΔMT2B2 embryos, but not Cdk2ap1ΔCAN/ΔCAN embryos, exhibit defective Cdk2ap1 protein expression in TE and impaired blastocyst formation. Representative confocal images for Cdk2ap1 and Nanog immunostaining are shown for wildtype (n=11), Cdk2ap1ΔCAN/ΔCAN (n=5) and Cdk2ap1ΔMT2B2/ΔMT2B2 (n=6) embryos. Scale bar, 25 μm. H. Deletion of Cdk2ap1ΔN (MT2B2), but not Cdk2ap1CAN, is associated with embryo implantation spacing defects. At E12.5, embryo crowding is evident in uteri from the Cdk2ap1ΔN (MT2B2)/+ × Cdk2ap1ΔN (MT2B2)/+ crosses (n=34), while resorption of correctly spaced embryos is evident in uteri from the Cdk2ap1ΔCAN/+ × Cdk2ap1ΔCAN/+ crosses (n=7). Black arrows, embryo crowding; *, resorbed embryos. Scale bars, 0.5 cm. All P values were calculated using unpaired, two-tailed Student’s t test. n.s., not significant. See also Figure S2 and Table S4.
