FIGURE 3.

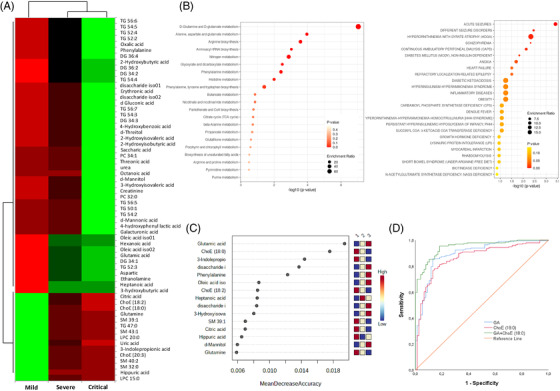
Metabolomic and lipidomic profile of coronavirus disease‐2019 (COVID‐19) patients grouped by disease severity. (A) Heatmap plots significant relative abundance of metabolites & lipids increasing or decreasing in accordance with disease severity. Significant differences (p‐values < .05) were determined by ANOVA test followed by post‐hoc Bonferroni correction for mean relative abundance between mild, severe and critical COVID‐19 groups of patients. Columns correspond to the degree of disease severity: mild (left), severe (centre) and critical (right) groups. Mean values for each compound in each COVID‐19 group (columns) are colour‐coded based on relative abundance, low (red) & high (green). (B) Metabolomic and lipidomic Kyoto Encyclopedia of Genes and Genomes (KEGG) enrichment analysis and related blood diseases in COVID‐19 patient cohort. Functional metabolic enrichment pathway of 15 metabolites selected from random forest modelling (Fisher's exact test. p < .05) (left), and the corresponding enriched blood pathway diseases (right). (C) Random forest modelling of significant metabolites and lipids with the highest classification accuracy. Right‐legend indicates the capacity of the compounds to differentiate groups of severity, blue (low) and red (high)
