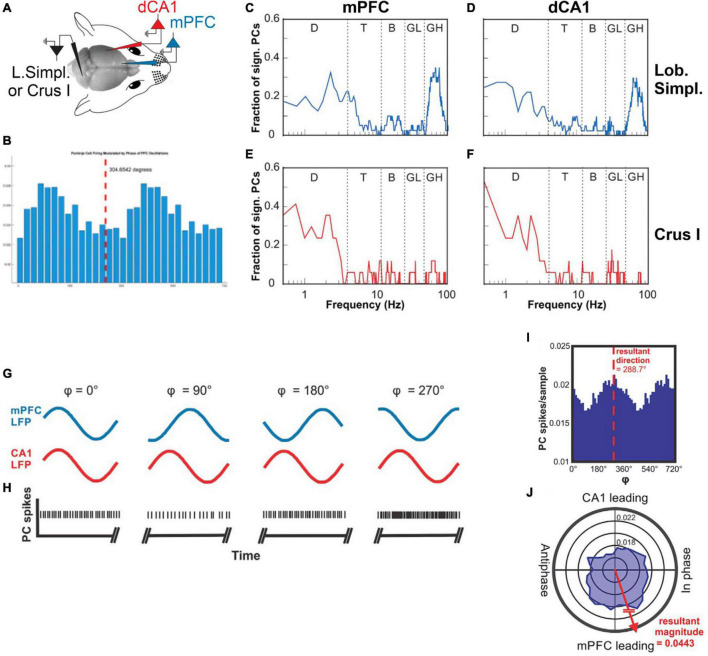
FIGURE 3.
Cerebellar representations of phase and phase differences of oscillations in the mPFC and CA1. (A) Illustration of the experimental setup with recording electrodes in the mPFC and dCA1, picking up LFPs and a recording electrode in cerebellar lobulus simplex recording single unit Purkinje cell spike activity. (B) Example histogram showing Purkinje cell simple spike rate plotted against the phase of a 10 Hz oscillation recorded in the mPFC. (C) Fraction of Purkinje cells in LS (n = 32) whose simple spike activity was significantly correlated with oscillatory phase plotted as a function of mPFC oscillation frequency (plotted on a log-10 scale). The function shows two peaks at the delta frequency range (0.5–4 Hz) and the high gamma range (50–100 Hz). (D) As in (C) but showing fractions of LS Purkinje cells significantly modulated by the phase of oscillatory activity in CA1. (E) Fraction of Purkinje cells in Crus I (n = 17) whose simple spike activity was significantly correlated with the oscillatory phase in mPFC plotted as a function of mPFC oscillation frequency. The function shows a single peak at the delta frequency range (0.5–4 Hz). (F) As in (E) but showing fractions of Crus I Purkinje cells significantly modulated by the phase of oscillatory activity in CA1. D, delta; T, theta; B, beta; LG, low gamma; HG, high gamma. (G) Illustration of hypothetical oscillations at a specific frequency occurring simultaneously in the mPFC (blue traces) and CA1 (red traces) and displaying different phase relationships (4) at different times. The phase relationship 4 is defined as the phase difference relative to the mPFC oscillation. (H) Hypothetical Purkinje cell spikes recorded simultaneously with the LFP activity in the mPFC and CA1 shown in (G). The rate modulation of this hypothetical Purkinje cell shows a significant increase in spike firing when the phase difference between mPFC and CA1 oscillations reaches values around 270°. (I) Phase histogram of real Purkinje cell simple spike activity. The histogram shows spike activity as a function of mPFC-CA1 phase differences at 11 Hz. The simple spike activity of the Purkinje cell in this example was significantly modulated as a function of mPFC-CA1 phase difference, with a preference of 288.7°. (J) Same data as in (I) represented in polar coordinates. Vectors composed of the angular value 4 and the magnitude of the spikes per sample were summated to determine the angular preference of Purkinje cell activity. The resultant vector magnitude was taken to quantify the degree of modulation and tested against surrogate results for statistical significance (from McAfee et al., 2019).

