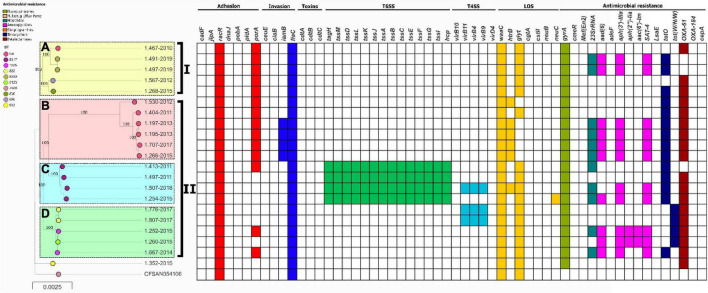
FIGURE 3.
Phylogeny of C. coli (n = 21) constructed by the maximum likelihood using strain CFSAN054106 as reference. The strains are represented by circles connected by branches proportional to the phylogenetic distance. The code of each strain is indicated as a label parallel to the corresponding circles. The genotypes (ST) among the studied population are denoted by different colors. The clades are denoted by the numbers I and II. The HierBAPS populations lineages found are highlighted by colored boxes and named A–D. The presence of virulence genes is denoted by blocks in color based on six categories: Adhesion (Red), Invasion (Blue), Toxins (Purple), T6SS (Green), T4SS (Light Blue), and LOS (Yellow). The presence of resistance genes is denoted by blocks in color according to the spectrum of action: Fluoroquinolones (green), Multidrug Efflux pump (Red), Macrolides (Blue), Aminoglycosides (Pink), Streptogramins (Orange), Tetracycline (Blue), and Beta-Lactamases (Brown). The names of detected genes are indicated above the blocks. The absence of a gene is indicated by a white block.

