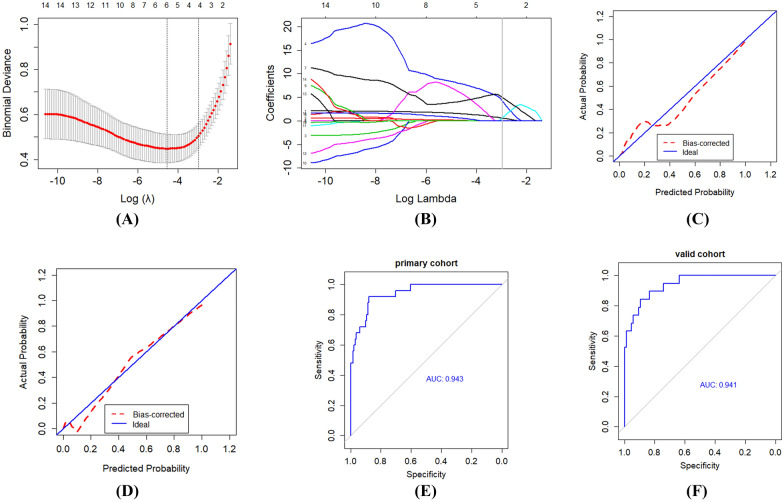
Fig. 3.
Feature selection and radiomics signature building using the least absolute shrinkage and selection operator (LASSO) binary logistic regression. A The parameter (λ) was screened using tenfold cross-validation method and parameter (λ) between two dotted lines was the optimal values using the minimum criteria and the 1 standard error of the minimum criteria (the 1SE criteria). B LASSO coefficient profiles of the 14 radiological features. A coefficient profile plot was conducted against the log (λ) sequence. λ value of 0.052, with log(λ) = − 2.96 was selected (1 − SE criteria) based on tenfold cross-validation. Vertical line was drawn at the value selected, which resulted in 4 non-zero coefficients. C, D Significant difference in radiomics score is shown between non-severe and severe groups in primary (C) and validation cohorts (D). E, F The receiver operating characteristic (ROC) curve for the radiomics signature. The calibration curves represent calibration of radiomics signature in terms of consistency between the predicted severe probabilities of COVID-19 and observed severe probabilities of COVID-19. The x-axis represents the predicted severe probabilities while the y-axis represents the actual probabilities. The actual probability was calculated by the formula PA = [1 + exp − (ax + b)] 1, where x = logit (p), p is the predicted probability, a is the slope estimates, and b is the corrected intercept. The 45° dotted line represents the perfect prediction of an ideal model and the dotted lines represents the performance of the built nomogram model, a closer fit to the dotted line represents a better prediction

