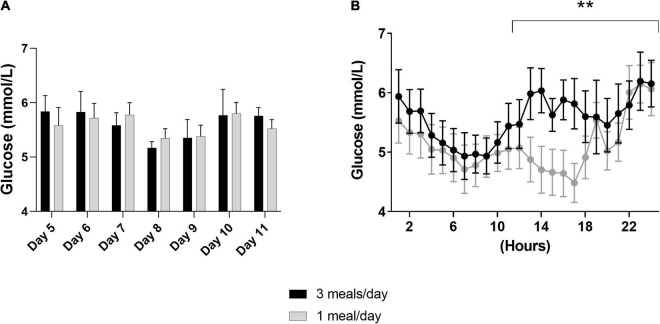
FIGURE 2.
Results of the continuous glucose monitoring data from both intervention periods. In a randomized crossover design, 11 healthy participants consumed all the calories needed for a stable weight in either three meals per day (3 meals/day, breakfast, lunch and dinner) or one meal per day (1 meal/day, between 17:00 and 19:00) for 11 days. Subcutaneous glucose concentrations were measured from day 5 to day 1,111. (A) Displays the mean of the overall glucose concentrations per hour from day 5 until day 11, whereas, (B) displays the glucose concentrations measured at day 9 (N = 9). Data are presented as mean ± SEM. **p < 0.01 assessed with two-way repeated measures ANOVA, N = number of participants included in statistical analyses and displayed in graphs.

