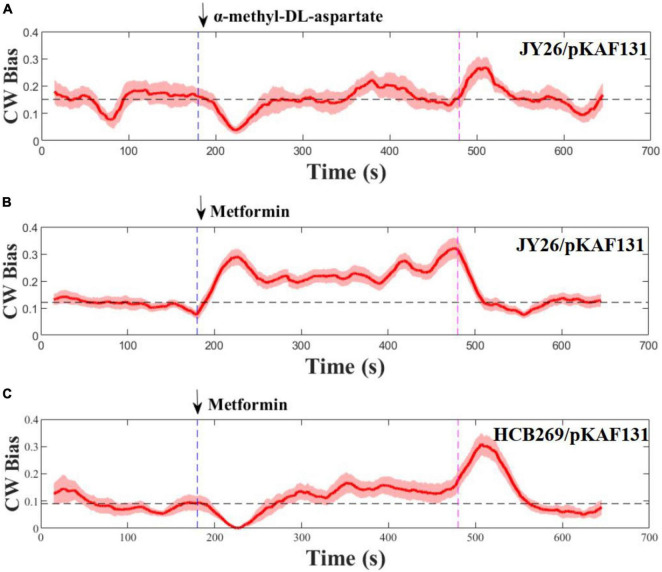
FIGURE 1.
Flagellar motor response to stepwise addition and removal of α-methyl-DL-aspartate and metformin. The metformin was added (blue) and removed (purple) at the times indicated by the vertical dashed line. The dashed black line represents the average of the CW bias from 0 to 180 s. Error areas for standard errors of the mean are shown under the CW bias curve (light red). (A,B) Wild-type strains for chemotaxis, (C) is the strain (Δtsr). The numbers of the flagellar motor measured at each section were 10, 28, and 12, respectively.

