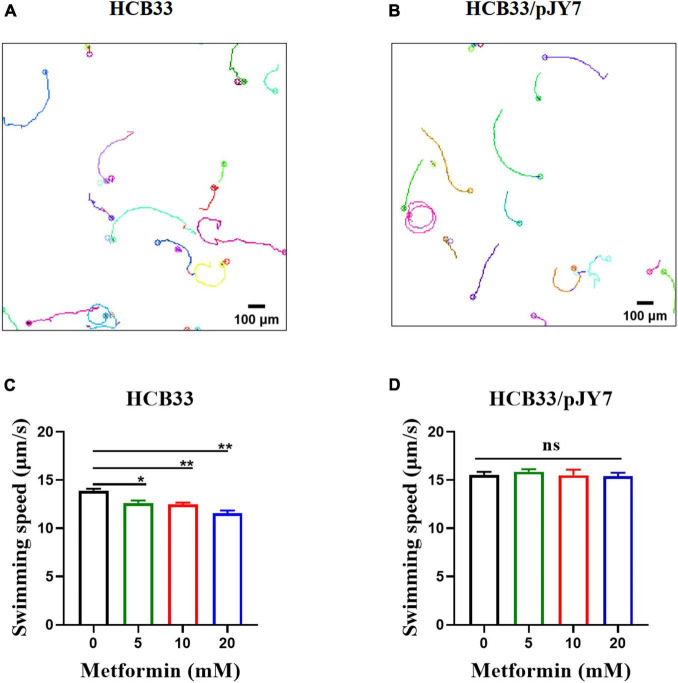
FIGURE 4.
Swimming of the cells cultured with various concentrations of metformin in a 2D homogeneous aqueous environment. (A) Trajectories of the cells that normally express MotA and MotB. (B) Trajectories of the cells that overexpress MotA and MotB. (C) The average swimming speed of the cells that normally express MotA and MotB cultured in T-broth with different concentrations of metformin. (D) The average swimming speed of the cells that overexpress MotA and MotB cultured in T-broth with different concentrations of metformin. *p < 0.05; **p < 0.01.

