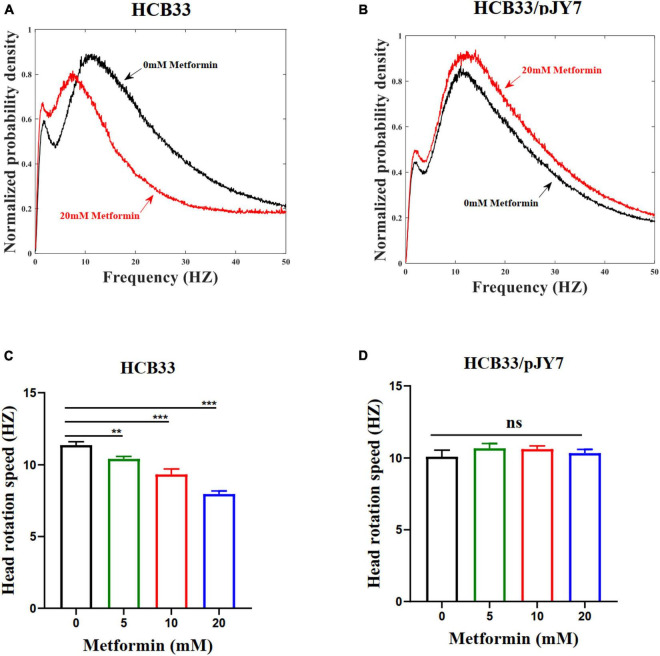
FIGURE 5.
The head rotation speed of the flagellar motor of E. coli cultured with various concentrations of metformin. (A) The cells that normally express MotA and MotB cultured in T-broth with 0 mM metformin (black line) and cultured in T-broth with 20 mM metformin (red line). (B) The cells that overexpress MotA and MotB cultured in T-broth with 0 mM metformin (black line) and cultured in T-broth with 20 mM metformin (red line). (C) The average head rotation speed of the cells that normally express MotA and MotB was 11.37 ± 0.23 Hz, 10.41 ± 0.17 Hz, 9.33 ± 0.37 Hz, and 7.96 ± 0.21 Hz corresponding to the concentrations of metformin. (D) The average head rotation speed of the cells that overexpress MotA and MotB was 10.09 ± 0.47 Hz, 10.67 ± 0.31 Hz, 10.62 ± 0.22 Hz, and 10.34 ± 0.24 Hz corresponding to the concentrations of metformin. The bars and errors are MEAN and SEM. **p < 0.01; ***p < 0.001.

