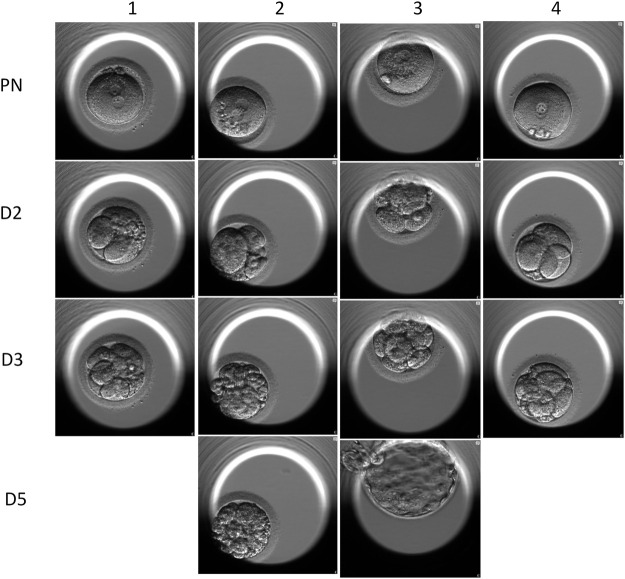
FIGURE 6.
Time-lapse images of the embryos of the ICSI cycles. Line 1 shows that the four embryos all carried 2 PN. Line 2 shows the 2-day embryos, and the embryo scores were 421, 243, 512, and 411. Line 3 shows the 3-day embryos, and three of the four embryos were qualified as good quality. Line 4 shows the two transferred blasts.

