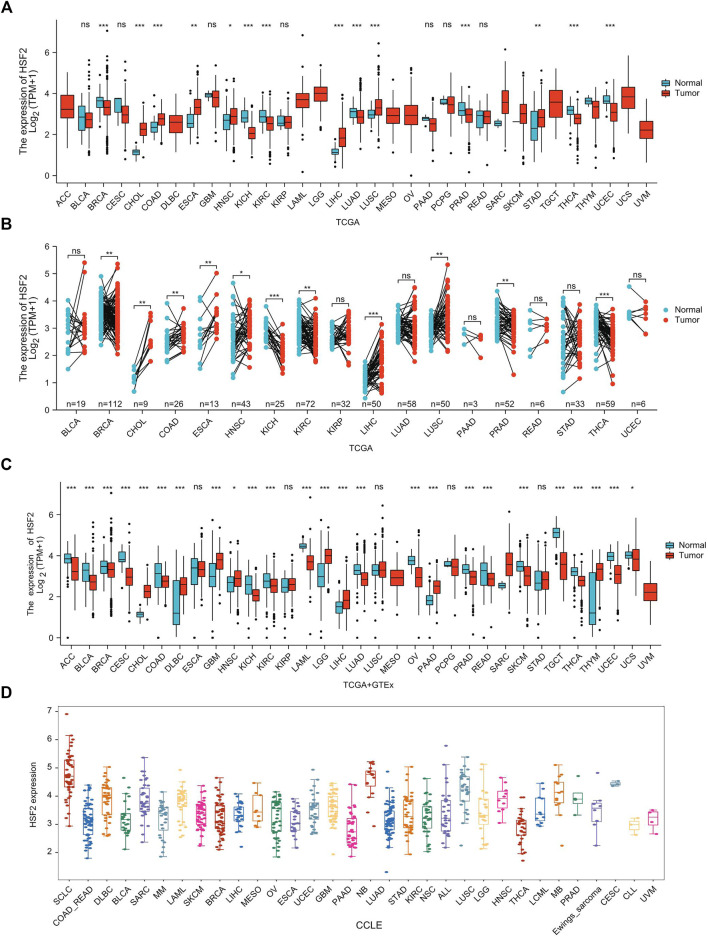
FIGURE 1.
HSF2 expression levels in pan-cancer. (A) Upregulated or downregulated expression of HSF2 in various human cancers from TCGA datasets. (B) Increased or decreased expression of HSF2 in paired cancer tissues and adjacent normal tissues from TCGA datasets. (C) HSF2 differential expression across different cancer types in the TCGA and GTEx databases. (D) The mRNA level of HSF2 in different cancer cells according to the CCLE database. *p < 0.05; **p < 0.01; ***p < 0.001.

