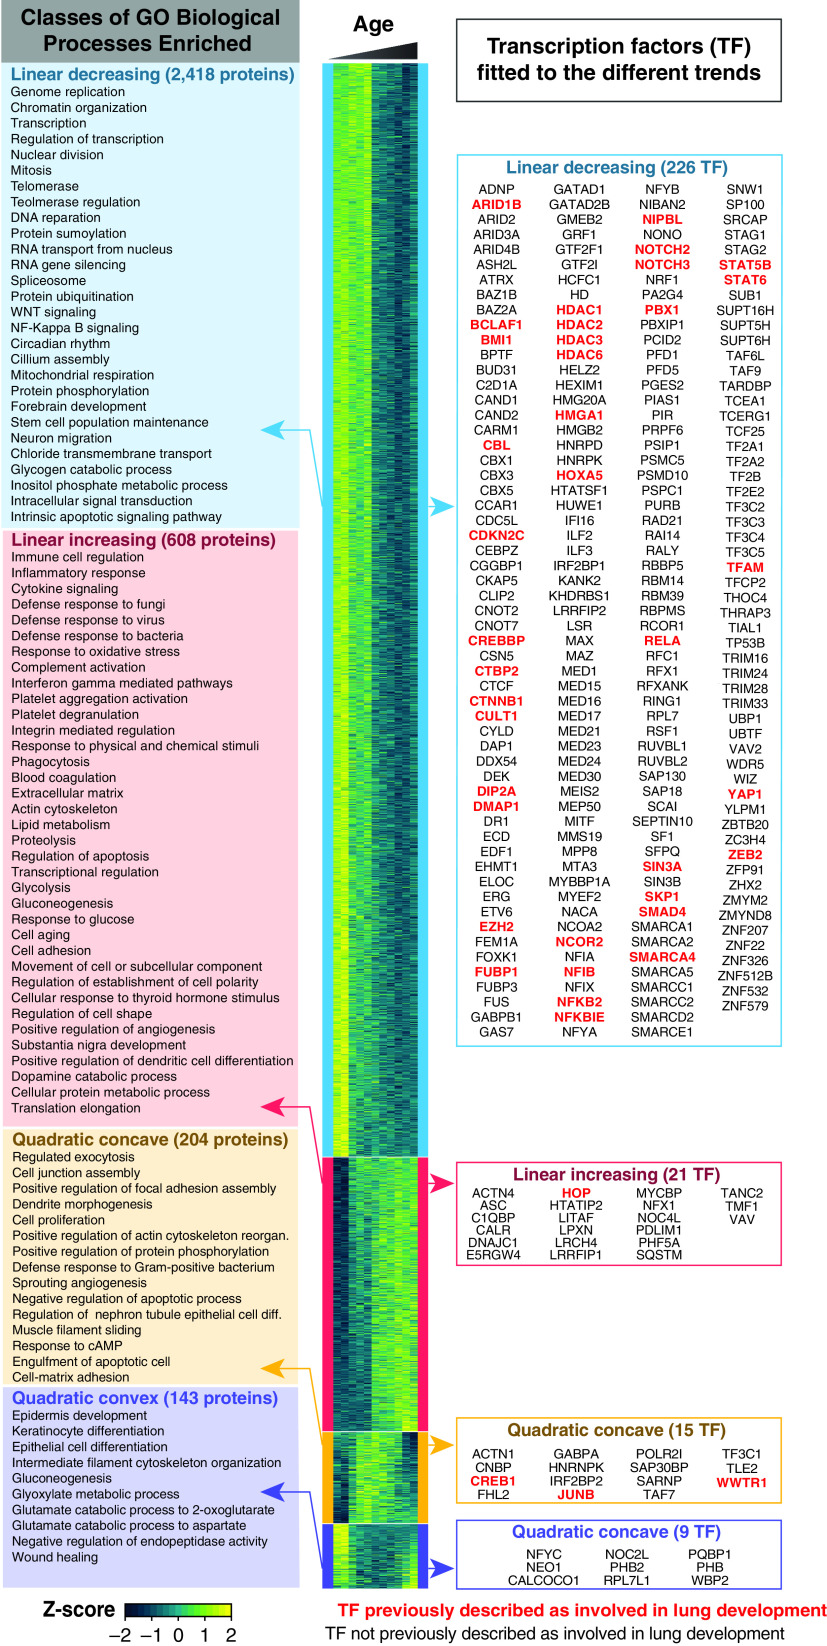
Figure 3.
Biological Process Gene Ontology (GO_BP) terms and transcription factors associated with different temporal models. The heat map depicts the proteins fitted to linear decreasing (blue), linear increasing (red), quadratic concave (yellow), and quadratic convex (purple) models (fitting P < 0.05). The boxes on the left panel represent the GO_BP enrichments generated using DAVID. All GO_PB terms enriched for the proteins belonging to either of the quadratic trends are depicted in the right panel. For the linear trends, to reduce GO_BP redundancy, the number of “GO classes” was reduced using the cytoscape plugin EnrichmentMap (a detailed version of these enrichment maps is provided as Figure E1). The left panel lists the transcription regulators fitted to each of the trends. In bold red are the transcription regulators previously described as important for pulmonary development (see Datasets E7 and E9).

