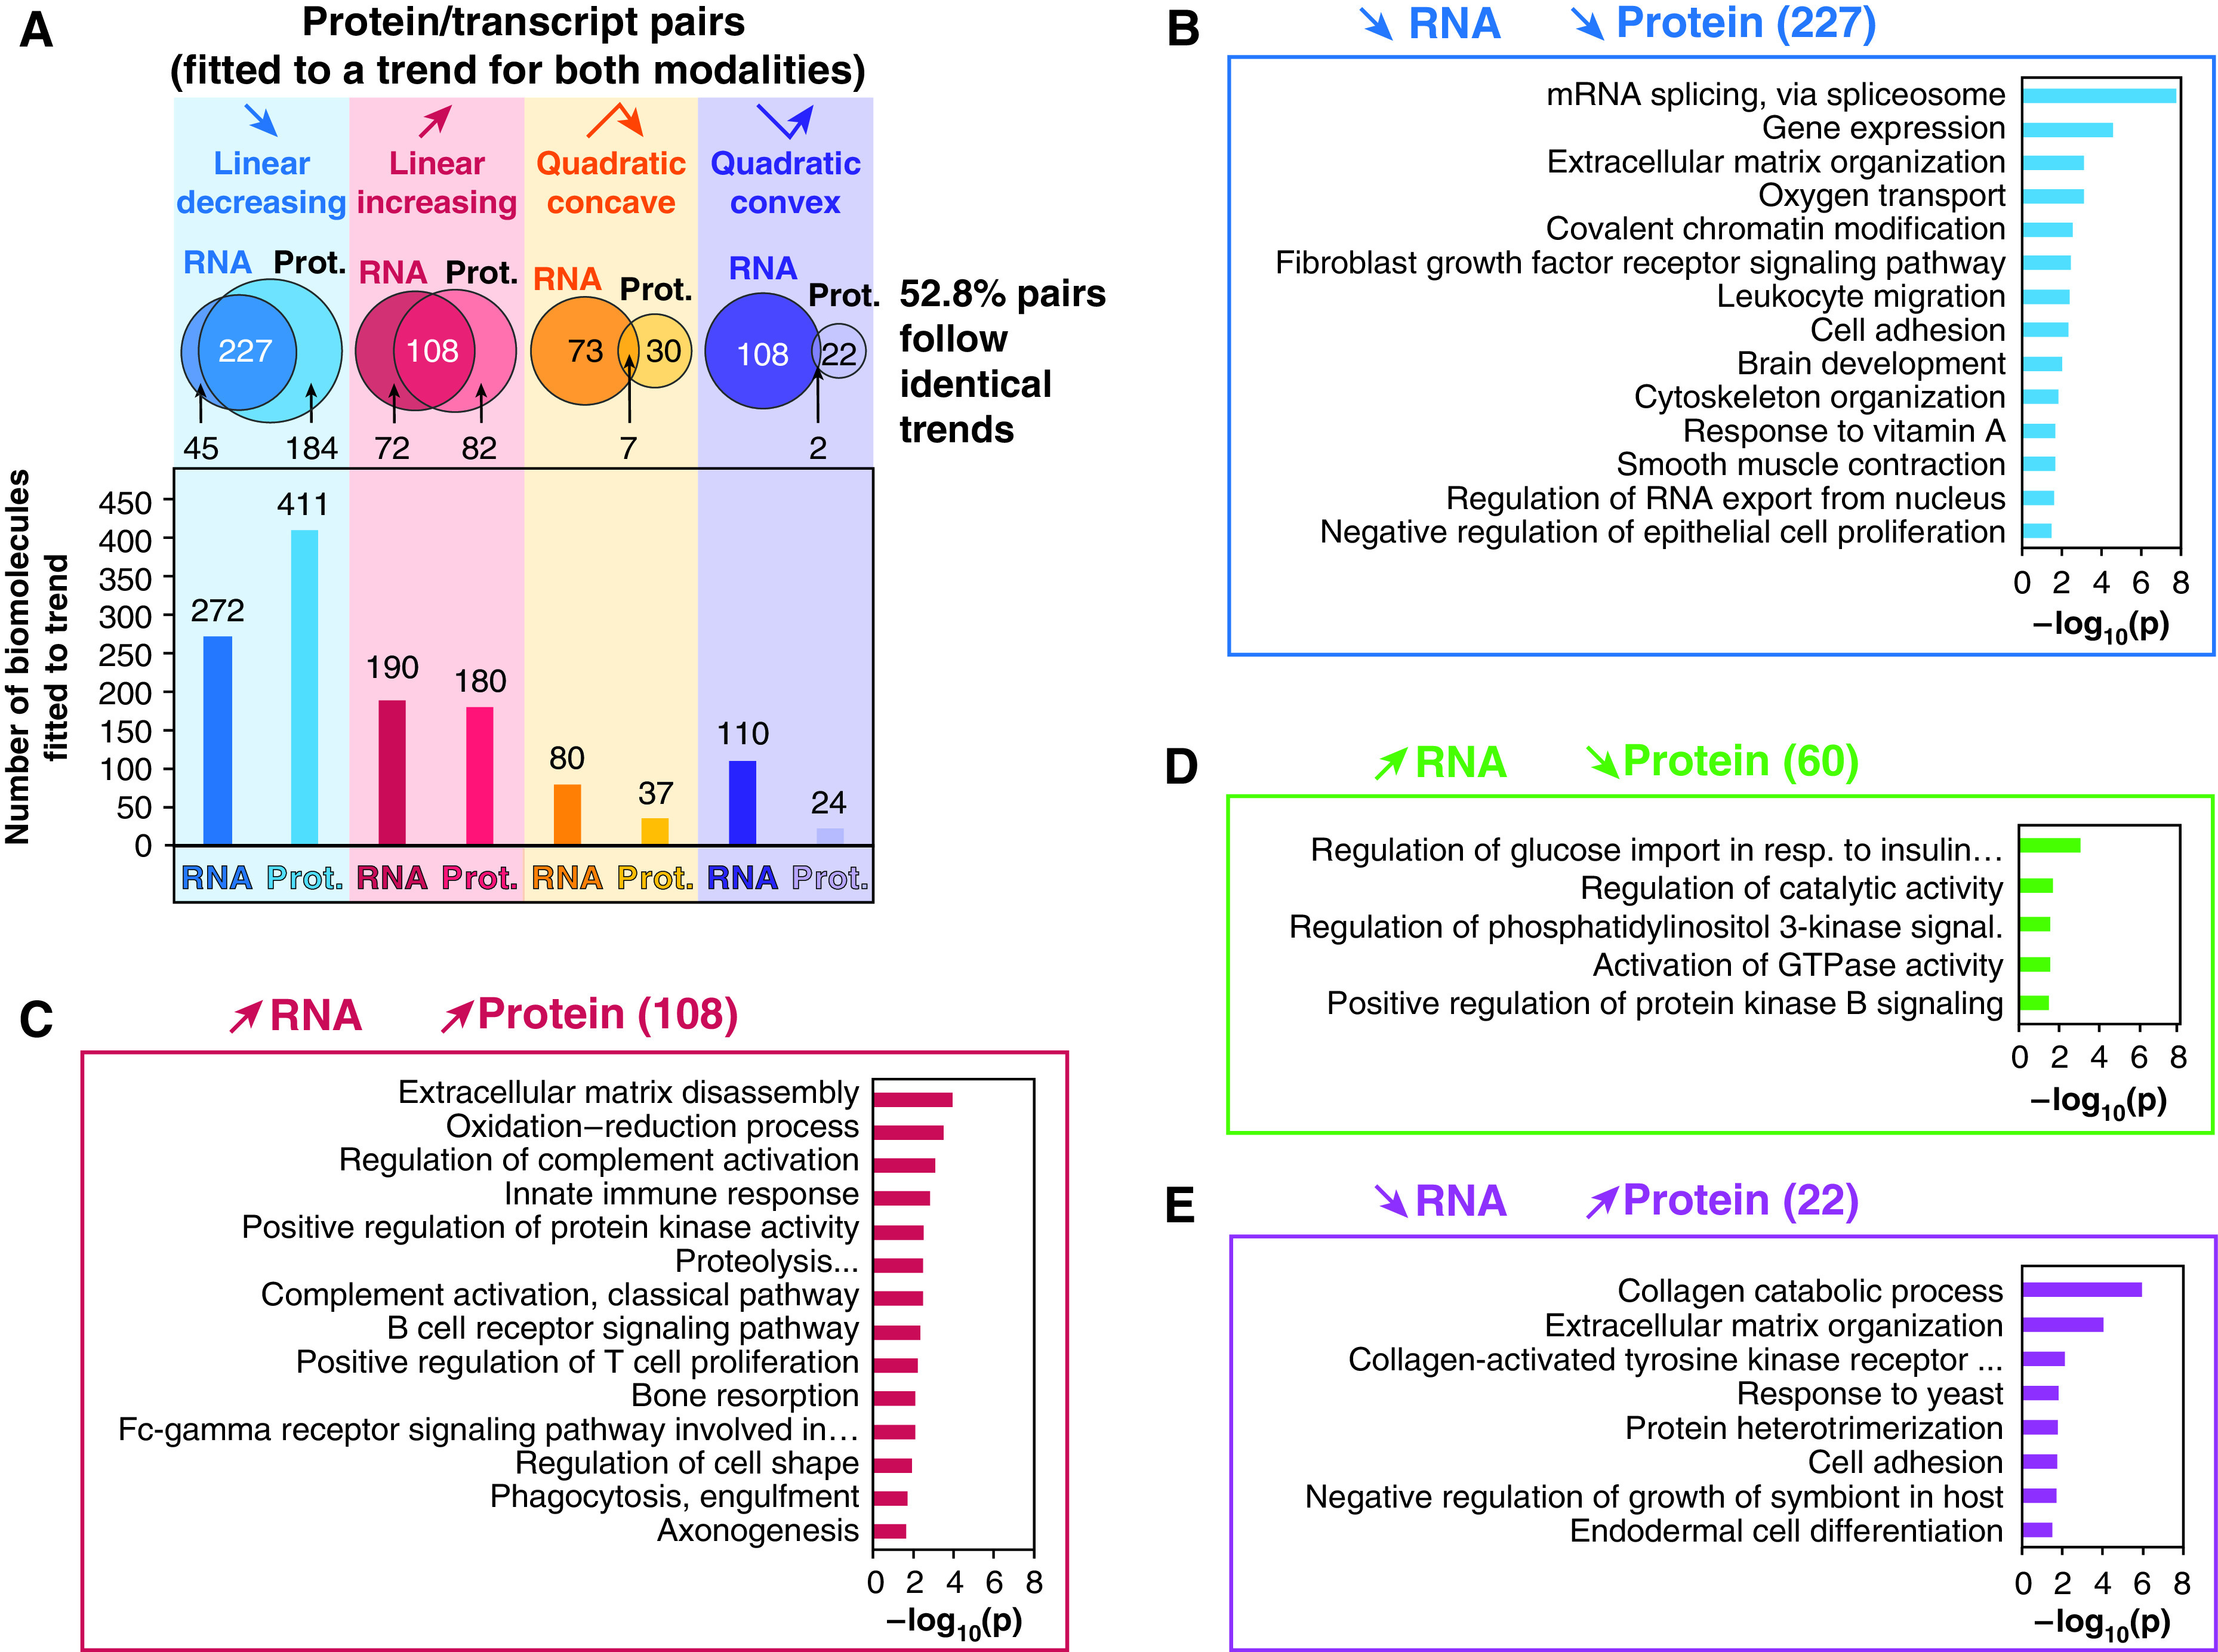
Figure 5.

Trend and enrichment analysis for the RNA/protein pairs. Only the 652 pairs of RNA/proteins both fitted to one of the four described trends were used to generate this figure. (A) The bar plots show the count of RNA/proteins fitted to each one of the four trends, and the Venn diagram indicates the number of matching and nonmatching protein/RNA pairs for each trend. (B–E) Representative DAVID GO_BP enrichment analysis identified enriched pathways associated to linear matching (B and C) or opposite trends (D and E) for RNA/protein pairs. Prot. = protein; resp. = response.
