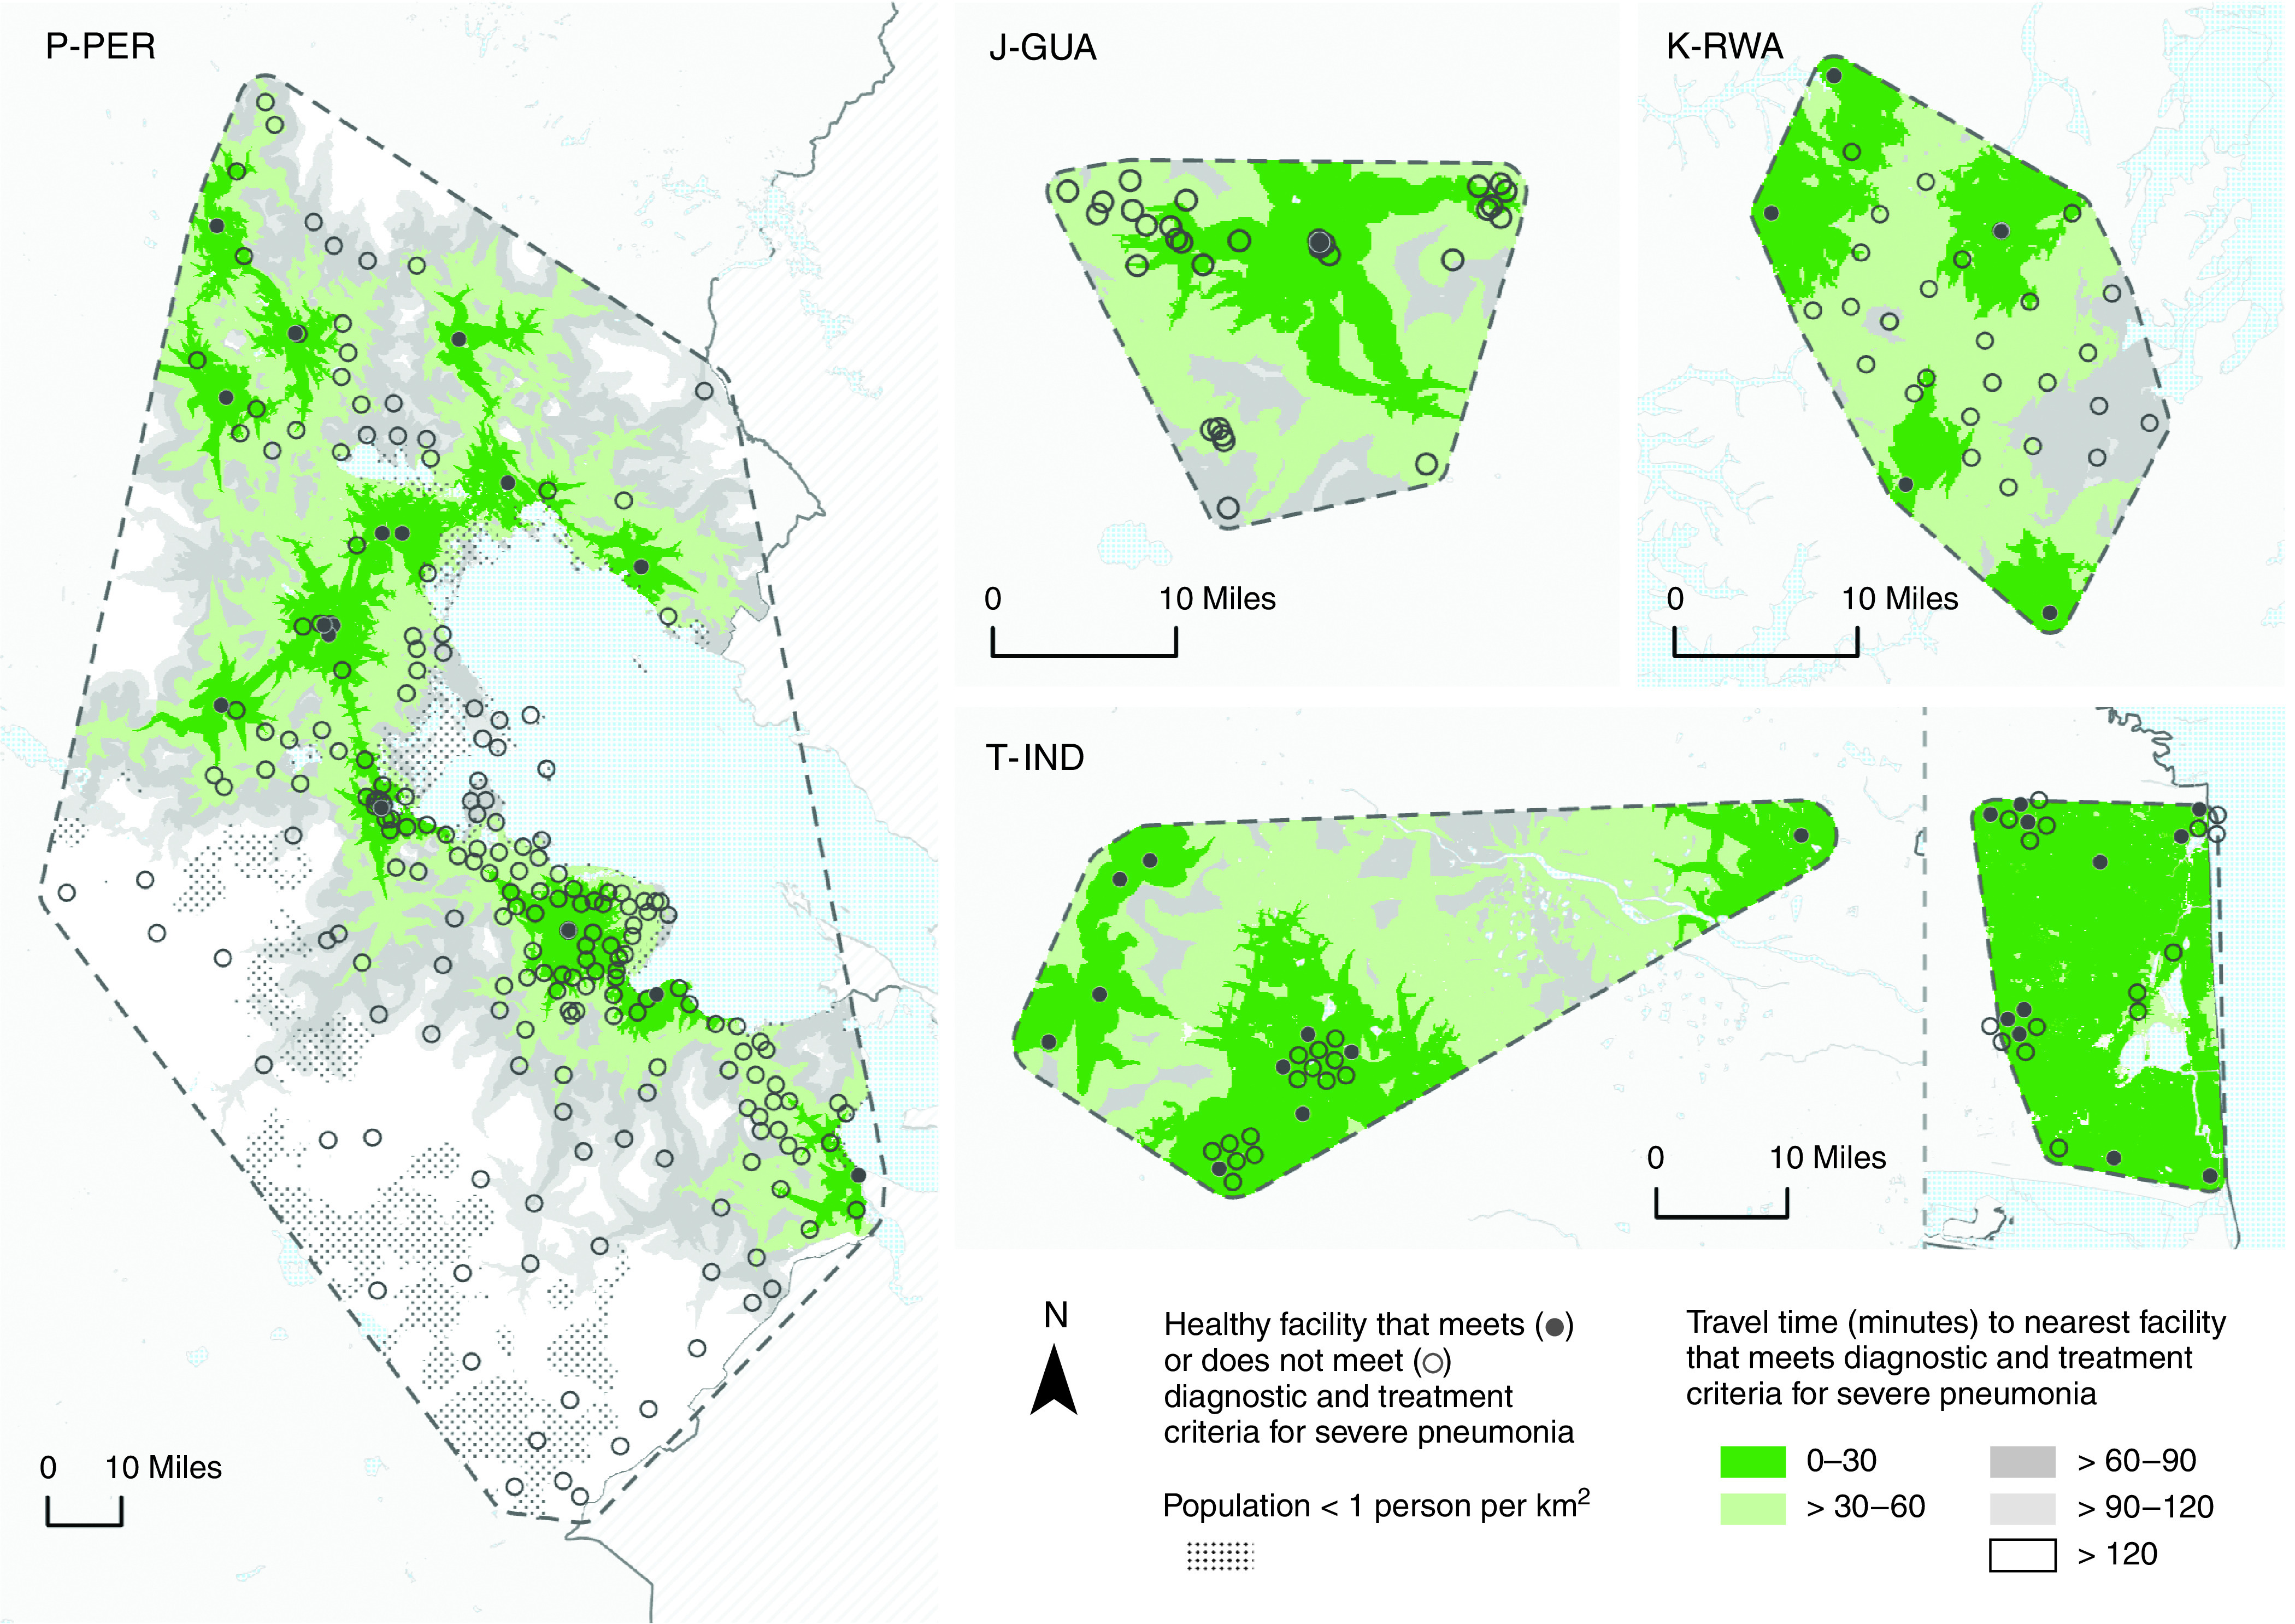
Figure 3.

Geographic accessibility to health facilities adequately resourced to diagnose and treat severe pneumonia in J-GUA, P-PER, K-RWA, and T-IND. Solid and open circles represent health facilities that do or do not meet criteria to manage severe pneumonia (i.e., open every day with overnight beds, a physician onsite, pulse oximeters, supplemental oxygen, chest radiography or ultrasound capacity, and antibiotics available), respectively. Shading identifies regions that are within 30, 60, 90, and 120 minutes of facilities meeting these criteria. All maps were constructed in ArcGIS Pro version 2.6.2. Health facility locations were based on Global Positioning System (GPS) coordinates measured by study staff, and the availability of resources was derived from a comprehensive survey administered to facility leaders. Mapping and analysis were limited to facilities that provided information about pneumonia treatment criteria in the survey. Study area boundaries were estimated by using buffers equaling the average distance between each health facility and its closest neighboring health facility. Road networks were constructed by using OpenStreetMap roads where motorized travel was possible. Each study area was divided into a gridded matrix of 0.1 × 0.1-km cells, and the origin–destination cost matrix solver from ArcGIS Pro Network Analyst was used to estimate the least-cost pathway in minutes from every cell to the nearest facility meeting pneumonia management criteria. Travel time accounted for road attributes, such as speed limits and directional limitations, and incorporated multiple modes of travel (i.e., walking to the road at 5 km/h and driving at half of the speed limit thereafter). Maps were not drawn to scale. The T-IND study site comprises two separate sites in Villupuram (left) and Nagapattinam (right). For definition of abbreviations, see Figure 1.
