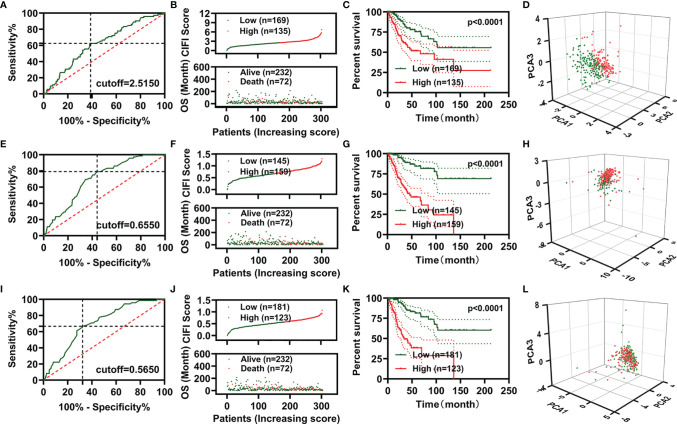
Figure 2.
Development of prognostic signatures based on FR-DEGs, IR-DEGs, and FI-DEGs. (A–D) Optimal cutoff value (A), distribution of the CIFI values (up) and survival status (down) (B), overall survival curves (C), and PCA plot (D) of the prognosis model constructed by three FR-DEGs. (E–H) Optimal cutoff value (E), distribution of the CIFI values (up) and survival status (down) (F), overall survival curves (G), and PCA plot (H) of the prognosis model constructed by six IR-DEGs. (I–L) Optimal cutoff value (I), distribution of the CIFI values (up) and survival status (down) (J), overall survival curves (K), and PCA plot (L) of the prognosis model constructed by eight FI-DEGs. DEGs, differentially expressed genes; FR-DEGs, ferroptosis-related DEGs; IR-DEGs, immune-related DEGs; FI-DEGs, ferroptosis- and immune-related DEGs; CIFI, comprehensive index of ferroptosis and immune status; PCA, principal component analysis.

