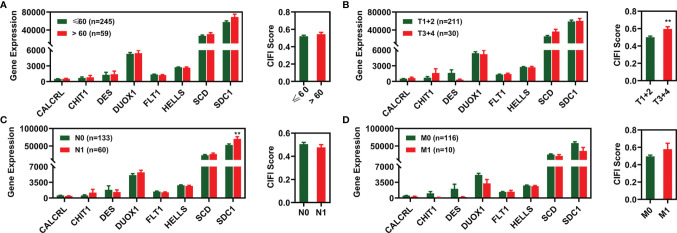
Figure 5.
Expression profile of 8 FI-DEGs (left) and CIFI value (right) in different clinical features. (A) Age. (B) Pathological T. (C) Pathological N. (D) Pathological M. **p < 0.01. DEGs, differentially expressed genes; FI-DEGs, ferroptosis- and immune-related DEGs; CIFI, comprehensive index of ferroptosis and immune status.

