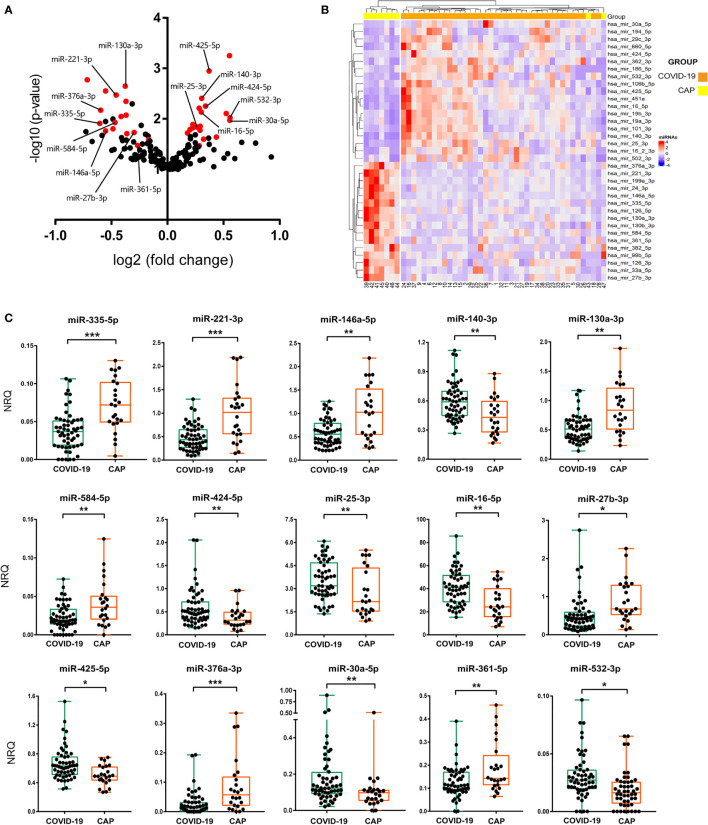
Figure 1.
miRNA signature in COVID-19 patients. (A) Volcano plot showing differential expression of 179 abundant miRNAs in human plasma between CAP and COVID-19 patients. Log2 of fold change of normalised relative quantities (NRQ) and statistical significance (–log10 of the p-value) from Mann-Whitney tests for each miRNA were assessed. In red, miRNAs with a corrected p value<0.05 assessed by multivariate statistical analysis. Names of the 15 miRNAs that were further validated are shown. (B) Hierarchical clustering heatmap of 35 differentially expressed miRNAs in plasma of 9 CAP and 38 COVID-19 individuals. Red and blue colour indicate upregulated and downregulated expression of COVID-19, respectively, as compared to CAP. (C) RT-qPCR of 15 validated miRNAs performed in the validation cohort. Box and whisker plots of NRQ for each miRNA are shown. A group of 4 highly stable miRNAs were used as normalisers. Statistical significance was assessed by means of multivariate statistical tests. *p<0.05, **p<0.01, ***p<0.001.

