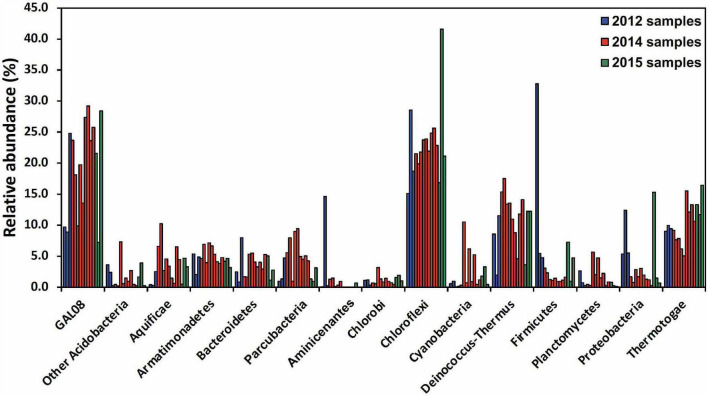
FIGURE 2.
Amplicon-based community analysis of 15 samples collected between 64.3 and 67.4°C at the Dewar Creek hot spring during three sampling trips in 2012, 2014, and 2015. Multiple samples at unique locations were collected during each sampling trip and each sample is represented as a separate bar color-coded by year. Only bacterial phyla that were at or above 3% relative abundance in at least 1 of the 15 samples are included. The Acidobacteria are split into DChs_GAL08 and all other Acidobacteria. Relative abundance data were calculated based on 16S rRNA amplicon sequencing.

