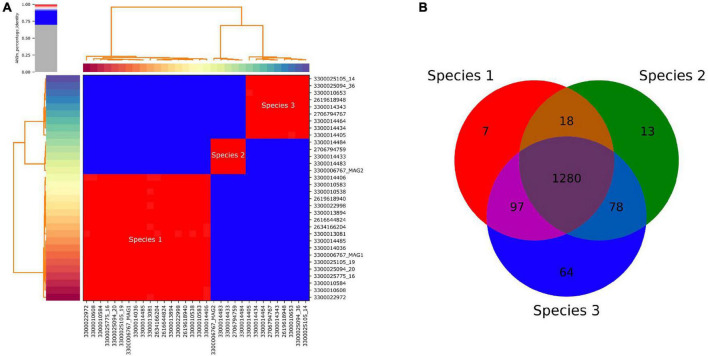
FIGURE 3.
(A) Pairwise average nucleotide identity (ANI) of all recovered single amplified genomes (SAGs) and metagenome-assembled genomes (MAGs) of DChs_GAL08, showing 3 distinct species-level clusters. Genomes are identified using JGI taxon IDs. The three red clusters all show >99.2% identity, while the blue clusters all have <88.1% identity. The figure was calculated and drawn using pyani (Pritchard et al., 2016). (B) Venn diagram based on the presence or absence of COGs in the three species.

