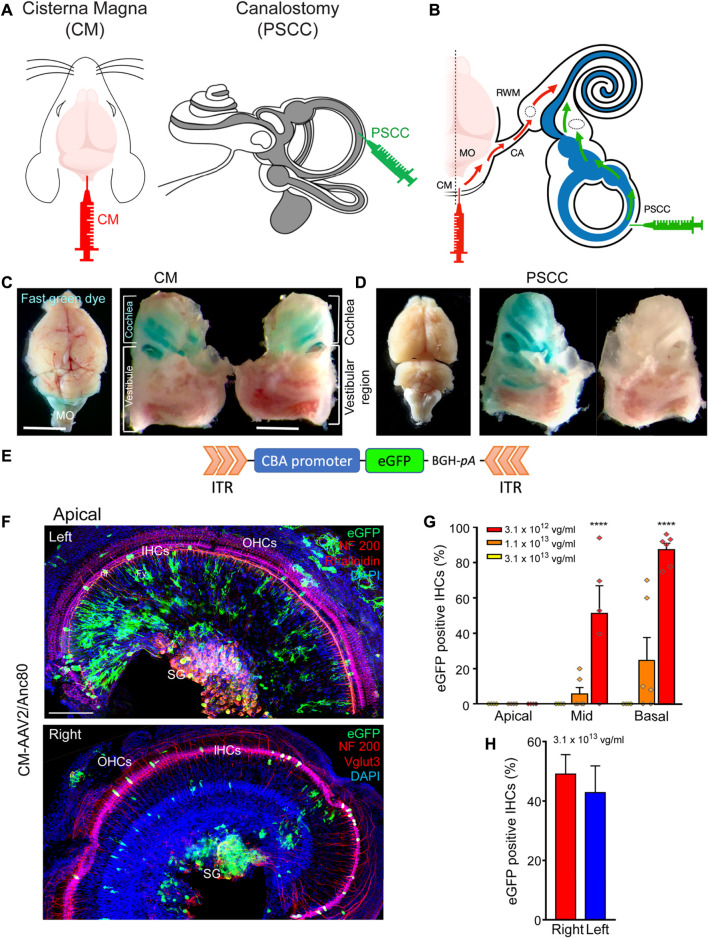
FIGURE 1.
CM injection and cochlear targeting efficiencies. (A,B): Schematics of the surgical approaches for Cisterna Magna (CM) and posterior semicircular canal (PSCC) canalostomy injection (A) and diffusion of viral vectors from the CM to the cochlea through the cochlear aqueduct (red arrows) and from the PSCC to the cochlea (green arrows) (B). The grey and white colors in (A) indicate the endolymphatic and perilymphatic spaces in the inner ear, respectively. (C,D): Stereomicroscope images of the dissected brain and cochleae following CM injection (C) and left PSCC injection (D) of green dye. Note the coloration of both cochleae and medulla oblongata (MO in C) after CM injection. Note the coloration of the injected cochlea and the vestibule after PSCC injection. (E): Schematic representation of the AAV recombinant genome for AAV2/8, AAV2/9, and AAV2/Anc80L65-CBA-eGFP. CBA: chicken β-actin promoter; eGFP: enhanced Green Fluorescent Protein; BGH-pA: Bovine growth hormone polyadenylation signal. ITR: Inverted terminal repeat. (F): Representative confocal images showing eGFP positive cells in flat-mounted preparations of the apical portion of the left and right cochleae 15 days after CM injection with AAV2/Anc80L65. eGFP positive cells are in green, NF200 immunolabelled auditory nerve fibres (nf, top and bottom images) and spiral ganglion neurons (SG, top and bottom images), Vglut three labelled inner hair cells (bottom image) and Phalloidin-labelled inner and outer hair cells (IHCs and OHCs respectively, top image) are in red. DAPI-labelled nuclei are in blue. Fy: fibrocytes. Scale bar: 50 µm. (G): Transduction efficiency (eGFP positive IHCs) as a function of concentration, at the apical, mid-, and basal regions of the cochlea, 2 weeks after CM injection with AAV2/Anc80L65 (n = 3 animals, six cochleae, for each concentration). (H): Average eGFP positive IHCs along the length of the cochlea from the left and right ears following a single CM injection with AAV2/Anc80L65 (n = 3 cochleae in each group). Data are expressed as mean ± SEM. One-way ANOVA test was followed by Dunn’s test: ***p ≤ 0.0001, the highest concentration vs. the lowest concentration.

