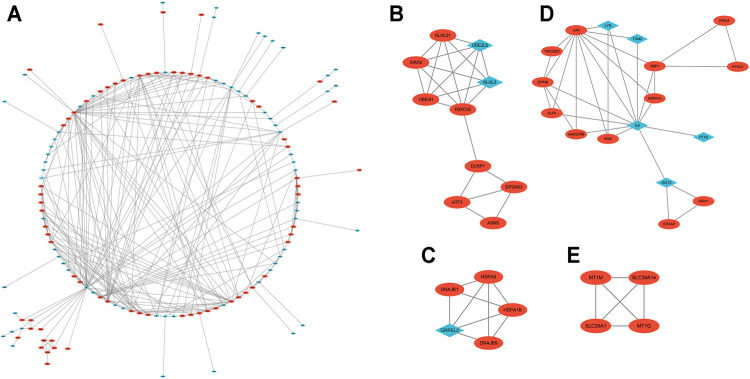
FIGURE 5.
The PPI network and two cluster modules were extracted by mCODE. (A) The PPI network of DEGs in GSE23289, which comprised 167 nodes and 334 edges. Each node represents a protein, while each edge between the two proteins shows a protein–protein correlation. The up- or downregulated genes are highlighted as red circles and blue diamonds, respectively. (B) Cluster mCODE 1 consists of 10 nodes and 21 edges. mCODE score = 4.667. KLHL21 is the seed gene in this subnetwork. (C) Cluster mCODE 2 includes five nodes and nine edges. mCODE score = 4.5. DNAJB9 is the seed gene in this subnetwork. (D) Cluster mCODE 3 includes four nodes and six edges, MT1M is the seed gene, score = 4. (E) Cluster mCODE 4 includes 17 nodes and 31 edges, ZFP36 is the seed gene, and score = 3.882).

