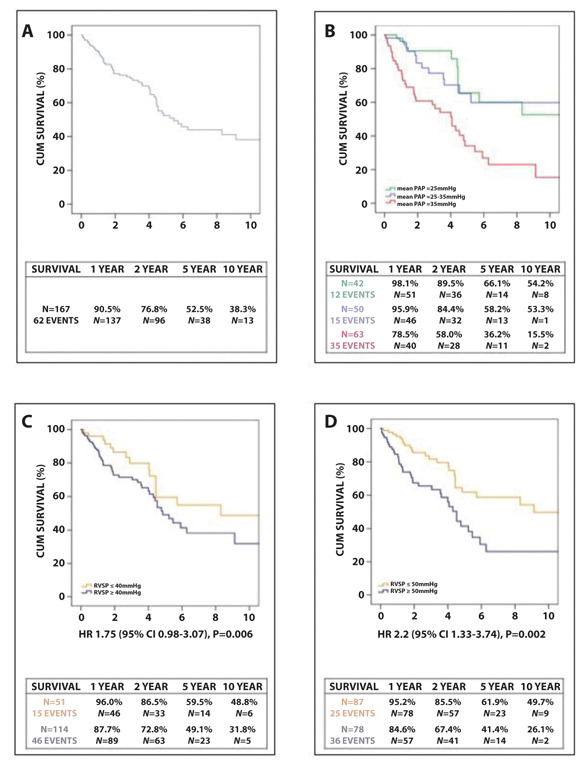
Figure 6.

Kaplan Meier survival curves with comparison between different subgroups. A. All patients; B. Divided by severity of PH (no PH, mild-moderate PH and severe PH), with a significant decrease in survival for severe PH ; C. RVSP>40mmHg (no significant difference in survival); D. RVSP>50mmHg (significant difference in survival).
