
Figure 1.
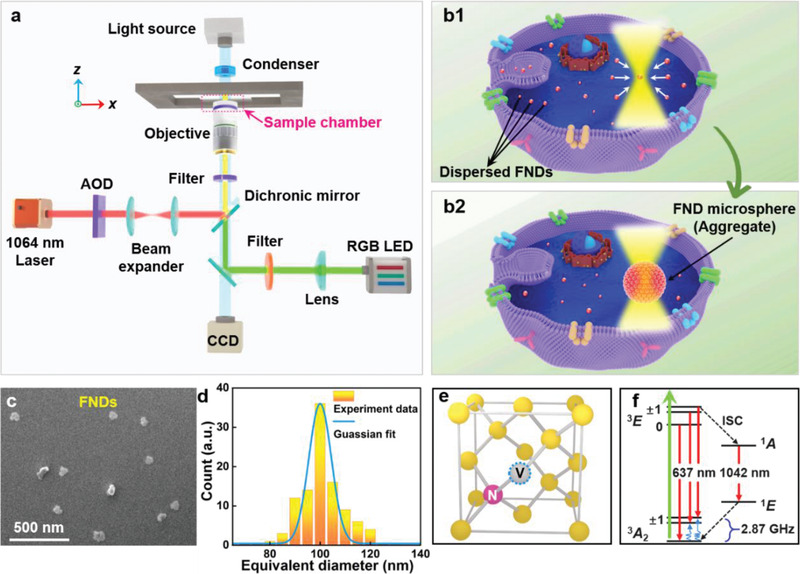
a) Experimental setup. b) Schematic of the intracellular aggregation of FNDs. The dispersed FNDs were endocytosed by living cells and then attracted by an optical trap (b1). More FNDs were gradually aggregated into a microsphere by the continuous action of the trapping laser (b2). c) Scanning electron microscope (SEM) image of the FNDs used in the experiments. d) Size distribution of the FNDs. e) Atomic structure and f) energy level diagram of the NV− center in the FND. The structure contains a carbon vacancy (gray sphere with blue dashed circle) paired with a substitutional nitrogen impurity (pink sphere). The green and red arrows and the blue sinusoid in (f) denote optical excitation, fluorescence emission, and microwave excitation, respectively.