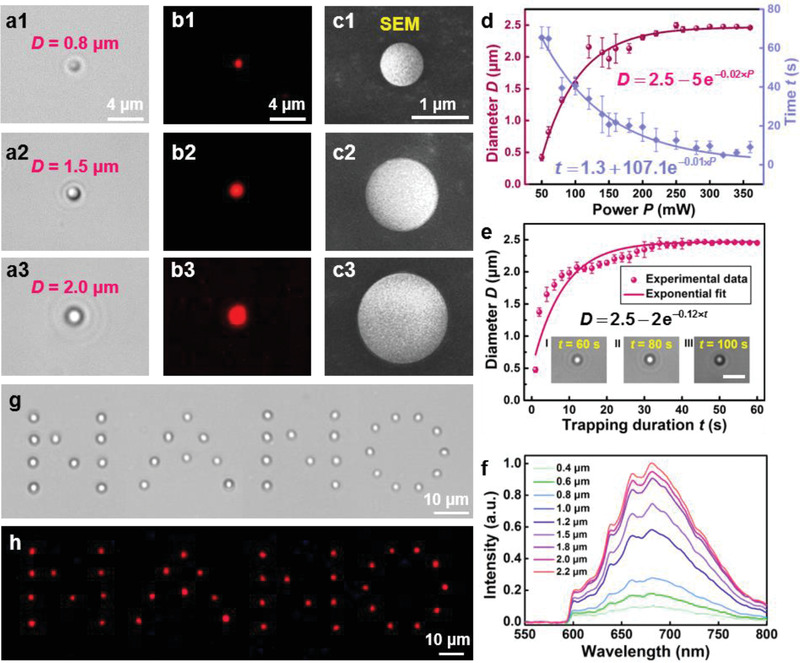
Figure 2.

a) Aggregated FND microspheres with diameters reaching 0.8 (a1), 1.5 (a2), and 2.0 µm (a3) by applying a trapping laser (power: 60 mW) for different times. b) Fluorescence images of the aggregated FND microspheres at a 546‐nm excitation light. c) SEM images of the aggregated FND microspheres corresponding to (a1–a3). d) FND microsphere diameters and stabilization time as functions of the trapping power. Error bars represent standard deviation of five representative measurements. e) FND microsphere diameter as a function of the trapping duration. Error bars represent the standard deviation of five representative measurements at the same trapping power. The insets show the aggregated FND microspheres with the durations of 60 (I), 80 (II), and 100 s (III), respectively. Scale bar: 5 µm. f) Normalized fluorescence intensity of the aggregated FND microspheres with different diameters. g) Patterning of the word “NANO” on the glass substrate using a customized scanning optical trap array. h) Fluorescence image of the pattern “NANO” at a 546‐nm excitation light.
