
Figure 3.
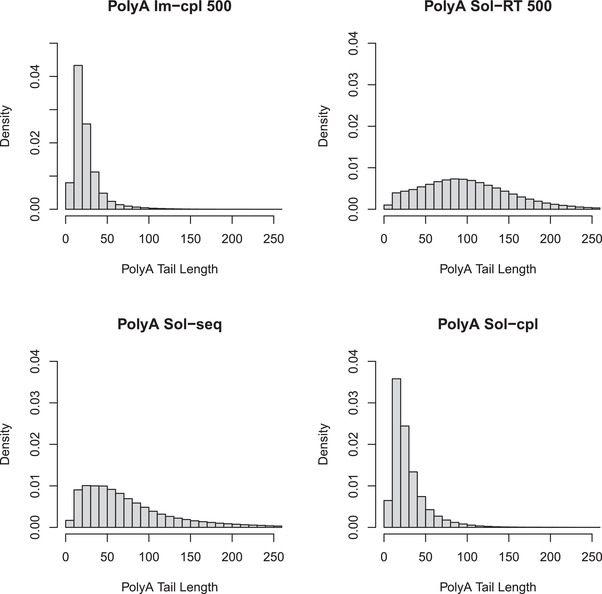
Poly(A) length analysis of Im‐cpl and Sol‐RT. Normalized 3′ poly(A) length subgroups were generated using the datasets produced with 500 ng L. monocytogenes RNA by the four protocols, depicted in Figure 2, with 10 nt bin size. The mean and median poly(A) lengths of different datasets are shown in Table S2 of the Supporting Information.