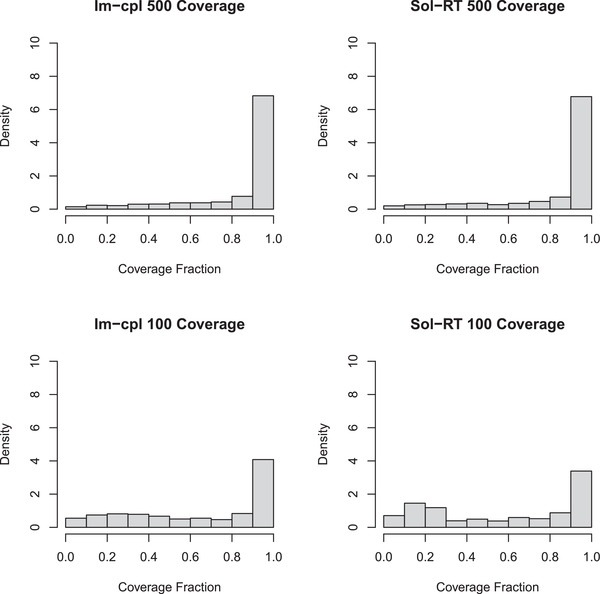
Figure 5.

The coverage of genes identified from various protocols with different RNA input amounts. A) Gene coverage from the entire Im‐cpl 500 library (three sequencing run datasets combined) from a single 500 ng input library. B) Gene coverage from a Sol‐RT 500 ng library (Sol‐RT 500). C) Gene coverage from Im‐cpl protocol with 100 ng of RNA input (Im‐cpl 100). D) Gene coverage from Sol‐RT protocol with 100 ng of RNA input (Sol‐RT 100).
