
Figure 4.
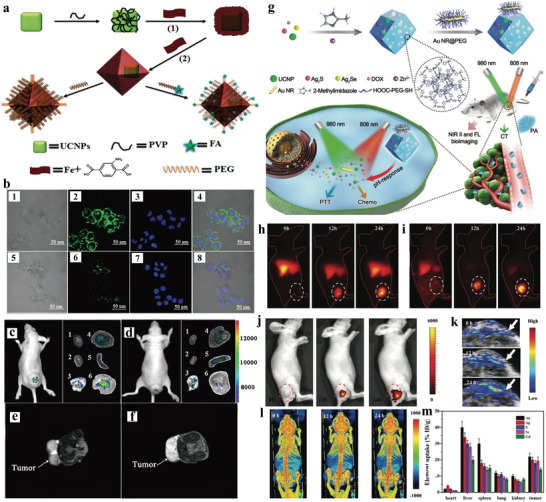
a) Schematic illustration of the synthesis of the core‐shell UCNP@Fe‐MIL‐101_NH2 nanostructures. b) CLSM images of the 1–4) KB cells and 5–8) MCF‐7 cells incubated with UMP‐FAs; UCL imaging of subcutaneous KB tumor‐bearing mice and dissected organs of the mice after intravenous injection of c) UMP‐FAs and d) UMPs. 1) heart; 2) kidney; 3) lung; 4) liver; 5) spleen; 6) KB tumor. The T 2‐MRI images of dissected tumor of KB tumor‐bearing mice treated with e) UMP‐FAs and f) UMPs. Reproduced with permission.[ 60 ] Copyright 2015, Wiley‐VCH. g) Schematic illustration of the synthesis of NPs@ZIF‐8@Au NR‐DOX for multimodal imaging‐guided combination phototherapy. In vivo FL imaging of h) Ag2S, i) Ag2Se, and j) UCL. k) PA and l) CT imaging of tumor‐bearing mice at different time points. m) Amounts of various elements in tissue samples measured by ICP‐MS. Reproduced with permission.[ 61 ] Copyright 2018, Wiley‐VCH.