
Figure 7.
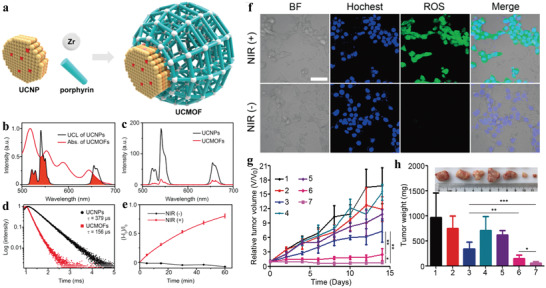
a) Schematic showing the photodynamic effect of the UCNP‐MOF heterodimers upon NIR light irradiation. b) UCL spectrum of the PVP‐coated UCNPs and UV–vis absorption spectrum of the UCMOFs. c) UCL spectra and d) UCL decay curves of the emission at 541 nm of PVP‐coated UCNPs and UCMOFs. e) 1O2 generation by UCMOFs with and without NIR irradiation, detected by SOSG assay. f) Confocal fluorescence images of 4T1 cells treated with UCMOFs and DCF‐DA, with or without NIR irradiation. Scale bar, 50 µm. g) The tumor growth curves after exposure to different treatments. h) Final weights of tumor tissues 14 days after treatment. Inset: representative images of the tumors for the seven groups of mice at day 14 (1: saline, 2: NIR, 3: DOX, 4: UCMOFs, 5: DOX/UCMOFs, 6: UCMOFs + NIR, 7: DOX/UCMOFs + NIR). Data are means ± SD; N = 5. *p < 0.05, **p < 0.01. Reproduced with permission.[ 37 ] Copyright 2017, American Chemical Society.