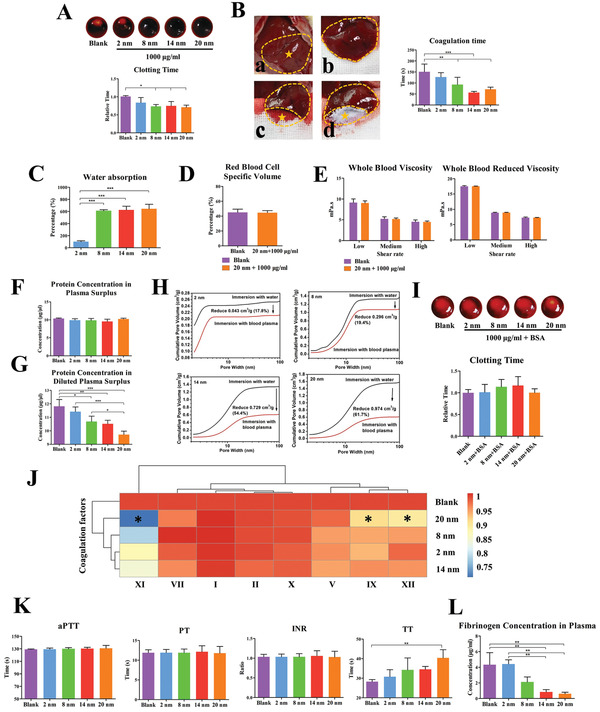
Figure 3.

The effects of mesopore size on blood clot formation. A) Coagulation time test in vitro. B) Coagulation time test in vivo using rat liver injury model. a) Exposure of the liver. b) Exposure of the left inner lobe of liver. c) Liver injury in control group. d) Liver injury site covered with mesoporous silica. C) Water absorption capacity test. D) Red blood cell specific volume test. E) Blood viscosity test. F) Protein concentration of plasma surplus after mesoporous silica adsorbed. G) Protein concentration of diluted plasma surplus after mesoporous silica adsorbed. H) Pore volume changes after mesoporous silica adsorbing protein. I) Coagulation time test in vitro using BSA pre‐adsorbed mesoporous silica. J) Plasma coagulation factors concentration after mesoporous silica adsorbing. K) The aPTT, PT, INR, and TT tests using mesoporous silica‐adsorbed plasma. L) Plasma fibrinogen concentration after mesoporous silica adsorbing using fibrinogen ELISA. Data are presented as means ± s.d.; n = 3; *p < 0.05, **p < 0.01, ***p < 0.001 by one‐way ANOVA with Tukey's post hoc test or unpaired two‐tailed Student's t‐test.
